

NeuroLogic: Fundamentals
EEG Fundamentals
0 of 47 complete
Welcome
Read the signal, then report what it shows
This self-paced course is designed for neurology residents and clinicians beginning to read scalp EEG. Each topic combines an explanation, a model or clinical example, and a short check. Experienced readers can use individual lessons for review.
About 5 hours 40 minutes53 short lessons · learn in order or choose a topic from Contents
Before you start the course
Take the pre-test
Answer the short pre-test before you start, and the matching post-test after the last lesson. Together they show what the course teaches you and help us improve it. A random study code pairs the two; no names or email addresses are collected.
The test link is loading.
Submit the Google Form, then come back here. Opening the link alone does not record a response.
Use a code saved on another device
By the end, you can:
- Explain where the scalp signal comes from and why a channel compares two inputs.
- Use the 10–20 map, montages, filters, and polarity to describe what appears on a page.
- Recognize common background, sleep, artifact, and abnormal patterns, then organize a report.
Course topics
- Signal Physiology
- 10–20 & Montages
- Filters & Digital Recording
- Description Language
- Normal Background & Sleep
- Normal Variants
- Artifacts & Activation
- Interictal Discharges
- Critical Care Patterns & Seizures
- The Report
Many lessons open with a short narrated video that covers the same ground; watch it first, then read on. To watch them back to back, open Videos. Under each video are its chapters, a transcript and a short quiz.
From cortex to channel
Follow five steps from cortical current to recorded channel. This sequence explains polarity, montage subtraction, and the limits of scalp localization.
- Source population: Synaptic currents create graded postsynaptic potentials in cortical neurons. Single axonal action potentials are too brief and spatially scattered to dominate routine scalp EEG.
- Open field: Millions of similarly oriented pyramidal cells, over several square centimeters of cortex (often 10 cm² or more for a spike seen on the scalp), must be active with enough synchrony for their extracellular fields to add instead of cancel.
- Volume conduction: The summed field spreads through brain, cerebrospinal fluid, skull, and scalp. This passive journey attenuates and spatially blurs the signal; it does not create a new rhythm.
- Electrode potential: Each scalp electrode samples the local extracellular potential produced by the mixture of fields that reaches it. An electrode has no meaningful absolute voltage by itself.
- Channel difference: The amplifier displays Input 1 minus Input 2. The waveform therefore belongs to a channel (a comparison), not to either electrode alone.
A crowd is quiet at a distance when everyone speaks independently and loud when many people clap together. Cortical synchrony likewise emerges from interacting thalamocortical and intracortical networks; the thalamus is important for several rhythms, but it is not the sole conductor of EEG.
Scalp detection generally requires synchronous activation across several square centimeters of cortex; often-cited estimates begin around 6 cm², and most spikes seen on the scalp involve 10 cm² or more (Tao 2005), but detectability varies with depth, orientation, synchrony, amplitude, and competing background activity.

The diagram above traced cortex → extracellular field → volume conduction → electrode. Routine scalp EEG reflects the summed postsynaptic fields of synchronized cortical populations, not individual axonal spikes.
Spot check Follow the diagram from cortex to scalp. Which signal contributes most directly to routine scalp EEG?
Source population → open field → volume conduction → electrode potential → channel difference. That sequence is the conceptual spine of the course.
Ions, channels and membrane voltage
Every EEG signal begins as current crossing neuronal membranes. These three step-by-step drawings build the cellular vocabulary the rest of the course uses, one click at a time: why a neuron rests near −70 mV, how voltage-gated channels produce a 1‑ms action potential, and how excitatory and inhibitory postsynaptic potentials add.
Millivolts inside, microvolts at the scalp. Membrane voltages are tens of millivolts (mV): rest is about −70 mV and an action potential peaks near +30 mV. Scalp EEG is measured in microvolts (µV), roughly a thousand times smaller, because the electrode records only small extracellular currents summed across many cells and weakened by cerebrospinal fluid, skull and scalp.
| Ion | Inside | Outside | Equilibrium potential |
|---|---|---|---|
| K⁺ | about 140 mM | 3–5 mM | about −90 to −100 mV |
| Na⁺ | 10–15 mM | about 145 mM | about +60 to +70 mV |
| Cl⁻ | 4–10 mM | about 110 mM | about −65 to −90 mV |
| Ca²⁺ | about 0.0001 mM | about 2 mM | above +120 mV |
Where these ideas return
- Potassium sets rest. Because resting permeability is dominated by K⁺, a rise in extracellular K⁺ during intense firing depolarizes neighboring neurons and favors seizure spread.
- Sodium-channel inactivation sets refractoriness. Carbamazepine, phenytoin and lamotrigine stabilize the fast-inactivated state; lacosamide enhances slow inactivation.
- GABA-A receptors are Cl⁻ channels. Benzodiazepines and barbiturates act here. In immature neurons, high intracellular Cl⁻ can make gamma-aminobutyric acid (GABA) depolarizing, one proposed but debated reason these drugs work less reliably in neonatal seizures.
- Postsynaptic potentials outlast action potentials. Their long, overlapping currents are what summate into the scalp EEG, the subject of the next two lessons.
Step back through the first drawing: the voltage falls toward EK when K⁺ leak channels open, and only a small Na⁺ leak pulls it back toward −70 mV.
Spot check A cortical neuron rests near −70 mV. Which process sets most of that voltage?
Rest sits near EK because K⁺ leak dominates resting permeability. That is why extracellular K⁺ accumulation depolarizes neurons, and why the action potential ends as K⁺ channels open.
Continue the board-level review in How seizures start and stop.
Why EEG sees synapses, not single-neuron spikes
Routine scalp EEG is dominated by the extracellular fields of synchronized cortical postsynaptic currents. Duration helps explain temporal summation, but spatial alignment, cancellation, source extent, depth, and the competing background also determine detectability.
Predict: keep the cells aligned and increase their timing spread. Which event loses more of its summed peak: a brief biphasic action-potential-like event or a longer postsynaptic event?
The model below runs both events side by side. Each panel shows twelve model cells, standing for a much larger population, and the sum a distant electrode would receive.

Drag the timing spread down to 0 ms and up to 25 ms (it starts at 6 ms) and watch the right panel, then flip half the cells. Timing dispersion and geometric cancellation are different mechanisms. Watch what each does to the two sums.
Snapshot: at the combined peak
Sum keeps of its aligned height
Sum keeps of its aligned height
Each row is one model cell; a filled dot means it is active at the cursor. The bottom trace is the sum of the rows above it, in relative field units, not membrane voltage. Replay sweeps 120 ms in six seconds.
Why routine scalp EEG is dominated by postsynaptic fields
Brief axonal events have unfavorable temporal and spatial summation at the scalp. A quiet trace does not imply silent neurons. Likewise, synchrony is not itself epileptiform: alpha rhythms and sleep graphoelements also reflect organized population activity.
Two meanings of “spike.” A single axonal action potential lasts about 1 ms. An EEG spike is a 20–70 ms scalp waveform generated by a population of neurons. The terms describe different levels of physiology.
Compare the timing spread with the length of each event. Two events add only while they overlap in time.
Spot check Twelve aligned cortical cells each produce the same event, but their timing now spreads over about 10 ms. Which summed signal loses more of its peak at a distant electrode?
Duration buys temporal summation. Postsynaptic potentials last tens of milliseconds, so a population’s events overlap even when their timing scatters; action potentials last about 1 ms and do not. That is one reason routine scalp EEG reflects synaptic currents rather than axonal spikes.
Timing dispersion and geometric cancellation are different mechanisms. Here the timing is perfect; only the direction changes.
Spot check In a population with perfectly matched timing and strength, half of the cells are turned to point the opposite way. What happens to the summed field?
Two ways to lose a scalp signal. Timing dispersion removes brief events most; opposed geometry cancels any event, long or short. A scalp field needs both synchrony and similarly oriented cells, such as pyramidal neurons standing in parallel.
From ion flow to EEG polarity
Start with the extracellular space, because that is where the EEG electrode listens. A sink is a membrane region where conventional positive current enters the neuron. Removing positive charge makes the nearby extracellular space relatively negative. A source is the return-current region, where positive current leaves the cell and the extracellular space becomes relatively positive.
Pyramidal cells are aligned perpendicular to the cortical surface. When many of them activate together, the sink and source fields add as an open field. Move the synaptic current from the apical dendrites to the soma and the dipole flips, even though the cellular event can still be excitatory.
Try: switch between an excitatory postsynaptic potential (EPSP) and an inhibitory postsynaptic potential (IPSP), then move the synapse from apical dendrite to soma. Watch the extracellular sign and the scalp deflection change together.
Move the synapse, then follow the charge
EEG deflection
Compared with a fixed, quiet reference.
Schematic shape, not a measured voltage.
About this model
This figure represents an aligned population of pyramidal cells, with a fixed quiet reference. The return current is distributed across the membrane; its arrows show a simplified circuit.
The EPSP example uses inward Na+ current. The IPSP example uses inward Cl− current at a mature, hyperpolarizing synapse. Inhibition depends on ionic driving force and conductance, so polarity alone does not identify excitation, inhibition, or a neurotransmitter.
Keep the order straight: identify where current crosses the membrane, decide whether the nearby extracellular space is a sink or source, determine the dipole orientation, and only then predict the scalp polarity. Clinical EEG displays relative negativity upward.
Use the polarity rules and ion lab above: inward positive current at a superficial synapse removes positive charge from the nearby extracellular space, leaving relative negativity at the electrode.
Spot check Positive current enters a superficial apical dendrite during an EPSP. What does the nearby extracellular electrode sample?
Current in removes positive charge from the extracellular space. The sink is therefore relatively negative. Return current creates a source elsewhere, and the separation forms the dipole.
Continue the board-level review in What the scalp can see.
Dipole orientation and scalp maxima
Pyramidal cells stand perpendicular to the cortical surface, and the cortex is folded, so the fold decides which way the dipole points. A cell on a gyral crown points its dipole up at the scalp. A cell on a sulcal wall points sideways. Orientation changes the scalp field. The field maximum alone cannot uniquely determine the generator.
Try these three comparisons:
- Change orientation: select Radial, Oblique, then Tangential. Watch where the largest field moves and compare the Electrode overhead reading.
- Change depth: return to Radial and increase Source depth from 1.0 to 2.0. Watch the curve and the Peak strength reading.
- Compare two sources: reset depth to 1.0, then toggle Add an opposing source. Compare the field’s strength and shape with one source versus two.
How the cortex sets orientation
Radial · toward the scalp
Where the scalp field is largest
Blue −, upward · Red +, downward
About this model
The fold illustrates orientation; the depth slider separately controls source depth in relative units. The added source has equal strength, opposite orientation, and a fixed separation of 0.4 units. It is shown in the field panel.
Point dipoles in a homogeneous conductor, with zero reference at infinity. Field units are relative, not microvolts; the radial peak at depth 1 is 100 units. Electrode colors show polarity. Source symbols are schematic. A scalp maximum cannot uniquely locate a cortical source.
At 90° in this model: the field is zero directly above the source, with opposite-polarity peaks on either side. Neither peak alone locates the underlying cortical generator.
Why deep sources hide
Greater depth reduces and broadens the field in this model. Opposing cortical populations can partially or completely cancel, depending on their relative timing, strength, and geometry. Orientation and depth are separate variables; neither alone determines scalp detectability.
EEG and magnetoencephalography (MEG) provide complementary views. In a spherical approximation, MEG is preferentially sensitive to tangential sources, while EEG detects radial and tangential components. Real anatomy and noise also affect both recordings.
A pyramidal cell stands perpendicular to its own patch of cortex. On a sulcal wall, which way does that point relative to the scalp?
Spot check A focal discharge arises from cortex on the wall of a sulcus, so its dipole lies tangential to the scalp. What does the scalp field show?
The fold sets the dipole, and the dipole sets the field. A scalp maximum, or a pair of opposite maxima, does not by itself locate the generator: here the source lies between the two peaks, under the point where the field is smallest.
Once the field reaches the scalp, the next task is naming the electrode sites that sample it.
The international 10–20 map
The International 10-20 system turns four reproducible landmarks into a proportional scalp map. Electrode sites fall at 10% and 20% intervals, so the same labels can be applied across different head sizes. A label is a scalp coordinate, not a promise that the same cortical gyrus lies directly beneath it in every patient.
Vertex view of the scalp map

The four landmarks that anchor the map
The nasion–inion line and the line between the two preauricular points are each divided 10, 20, 20, 20, 20 and 10%, so the midline runs Fpz, Fz, Cz, Pz, Oz, and the two lines cross at Cz, halfway along each (Klem 1999). Current nomenclature renames the older T3, T4, T5 and T6 as T7, T8, P7 and P8; the sites are unchanged, and older reports may use either set (Acharya 2016).
Reference, ground, and contact: A1/A2 are auricular sites; M1/M2 are mastoids. Check electrode-skin impedance before recording and when artifact appears. American Clinical Neurophysiology Society (ACNS) guidance ordinarily keeps it at or below 5 kΩ, balanced across the array, but a near-zero reading can indicate a salt bridge that shorts adjacent electrodes together.
The midline is divided 10, 20, 20, 20, 20 and 10%. Add up the steps to Cz.
Spot check A technologist measures 36 cm from nasion to inion. How far from the nasion is Cz placed along that line?
Proportions, not fixed distances. Measuring every head lets the same label mark the same relative scalp position on small and large heads alike. Cz is the midpoint of both the nasion–inion and the ear-to-ear lines.
Spot check An outside report from years ago describes left temporal sharp waves maximal at T3. Which electrode is that in current nomenclature?
Only the labels changed: T3/T4 became T7/T8 and T5/T6 became P7/P8, which fits the logic of the 10–10 system (Acharya 2016). Read older reports with both sets in mind.
Test the map now. Lead Placement is the next lesson, while these locations are still fresh.
Review the full technical framework in Recording technique.
Bipolar montages and phase reversal
Voltage is measured between two points. An EEG channel displays the difference between its two inputs: Input 1 − Input 2.
An EEG montage is a logical display of differential channels. The longitudinal bipolar ("double banana") montage is an essential standard display, but no single montage is sufficient for every pattern. Clinical review uses complementary bipolar and referential displays and preserves the ability to reformat digitally.
Clinical page (first half)

- Left temporal
- Right temporal
- Left parasagittal
- Right parasagittal
- Midline
Montage layout

Common Mode Rejection (CMR): Differential amplifiers reject signals that affect both inputs equally (like line-frequency ambient hum) and amplify only the difference between Input 1 and Input 2. This is what lets a microvolt-scale cerebral rhythm survive alongside environmental interference that can be several orders of magnitude larger at the electrode.
Phase reversal is created by a shared electrode
In a bipolar montage, neighboring electrodes form a chain. For example, Fp1–F3 and F3–C3 share F3, but F3 is Input 2 in the first channel and Input 1 in the second.
Channel output = Input 1 voltage − Input 2 voltage
If Input 1 is −50 μV and Input 2 is −20 μV:
(−50 μV) − (−20 μV) = −30 μV (an upward deflection, because negative is up).
Follow the shared electrode
When a focal negative field is maximal at F3, it becomes the most negative point in the surrounding chain:
- Channel 1 (Fp1–F3): F3 is Input 2. Since Input 2 is the more negative input, the subtraction formula outputs a positive value (Fp1 − F3 = (−20) − (−100) = +80 μV). The channel deflects downward.
- Channel 2 (F3–C3): F3 is Input 1. Since Input 1 is the more negative input, the formula outputs a negative value (F3 − C3 = (−100) − (−25) = −75 μV). The channel deflects upward.
This creates a converging phase reversal at the negative chain maximum. A positive field creates a diverging reversal. A reversal localizes a voltage maximum in that chain; it does not, by itself, prove epilepsy or guarantee that the cortical generator lies directly beneath the electrode.

Subtract Input 2 from Input 1 for each channel, then remember that negative is drawn up.
Spot check In the right parasagittal chain, Fp2 is +10 µV, F4 is +90 µV and C4 is +15 µV at the peak of a discharge. How do Fp2–F4 and F4–C4 deflect?
Negative is up. A negative maximum makes the two channels sharing it point toward each other (a converging reversal); a positive maximum makes them point away (a diverging reversal). Either way, the reversal marks a voltage extreme in that chain, not proof that the discharge is epileptiform.
Bipolar math: five electrodes, four channels
Now isolate the arithmetic from the terminology. Change one electrode at a time and keep the five electrode voltages, all four subtractions, and all four traces visible together. Then apply the same reasoning to the clinical page immediately below.
1 / 9
Five electrodes, four channels. Each interior electrode is shared by the two channels either side of it; that is what makes a reversal possible.
Ch1 Fp1–F3
Ch2 F3–C3
Ch3 C3–P3
Ch4 P3–O1
Three patterns to recognize. A maximum on the last electrode of a chain appears in one channel only, with no reversal, and the chain cannot show whether the maximum lies at that electrode or beyond it. A broad plateau, with neighboring electrodes at the same voltage, cancels in the channels inside it, so the middle of the field looks flat while only its edges deflect. An electrode pop reverses in exactly the two channels that contain the faulty electrode, with no field around it.
A reversal needs two channels that share the maximum. How many channels contain O1 in this chain?
Spot check A surface-negative sharp wave is maximal at O1, the last electrode of the left parasagittal chain (Fp1–F3, F3–C3, C3–P3, P3–O1). What does the chain show?
The end of a chain gives half a reversal. Check the field on a montage that gives the electrode neighbors on both sides, such as a circumferential ring, or read it against a reference.
Work out each subtraction. What does a channel show when its two inputs are equal?
Spot check During a broad negative field, F3, C3 and P3 all sit at −80 µV while Fp1 and O1 stay near 0 µV. What do the channels Fp1–F3, F3–C3, C3–P3 and P3–O1 show?
Bipolar subtraction can hide the middle of a broad field. Flat channels flanked by opposite deflections suggest a plateau rather than a single maximum; a referential display shows its full extent and amplitude.
Bipolar practice: find the reversal
Two skills from the bipolar math lab, now on real pages. First, walk each chain until two neighboring channels deflect toward each other; the electrode they share is a local negative extremum along that chain. Second, read the channel list itself: front-to-back pairs in temporal, parasagittal, then midline chains name the double banana.
A phase reversal is not the biggest deflection on the page. It is two adjacent channels in the same chain turning to face each other because their shared electrode is more negative than its neighbors.
Spot check A real longitudinal bipolar page: the same double banana, on an actual recording. One sharp wave repeats through it. Tap or click the chain where two channels turn to face each other.

The reversal is at F8. Walk the right temporal chain down: Fp2–F8, F8–T8, T8–P8, P8–O2. The two channels that share F8 deflect against each other, identifying F8 as more negative than its immediate neighbors in this chain, so it drives Fp2–F8 one way and F8–T8 the other. T8–P8 and P8–O2 follow F8–T8 in the same direction, only smaller: the field falls away behind F8 without turning again.
A bipolar reversal follows from a shared electrode entering adjacent channels with opposite signs. In a referential montage, Input 2 is shared throughout. Opposite referential deflections can still represent opposite field polarities.
Longitudinal chains run front to back; transverse rows run left to right; circumferential closes a ring; referential labels pair single electrodes with one reference.
Spot check Ignore the blink and read the channel list on the left. What montage is this page?

Longitudinal bipolar, the double banana. Left temporal over right temporal, then left parasagittal over right parasagittal, then a short midline chain. Each channel is a neighboring pair subtracted front to back.
Name the montage from its channel labels and connections. A blink or other waveform does not change the montage.
Referential montages and common average
Bipolar channels can attenuate a broad field when neighboring electrodes have similar voltages. A referential view provides another way to inspect the same distribution.
In a referential montage, each active scalp electrode is compared with a shared reference. A common average reference (CAR) is one useful computed option, not a universally superior standard:
- Mathematical average: CAR sums the potentials of all active scalp electrodes (19 in the standard 10-20 array) and divides by the total number, creating a computed baseline reference.
- Amplitude and field distribution: The largest deflection helps identify the scalp maximum of a field, but source orientation, depth, reference composition, and volume conduction prevent a simple one-to-one equation between amplitude and generator proximity.
- Reference contamination: If a single electrode suffers a massive artifact (e.g., a loose electrode or localized muscle spike), that high voltage is mathematically distributed into the common average, causing a "paradoxical" ghost artifact to appear across every other channel.

Full EEG page · common average reference
Every referential channel is electrode minus the reference. What is the common average made from?
Spot check On a common average reference display, a large electrode pop at T7 comes with small deflections of opposite polarity in every other channel at the same instant. Why?
One bad electrode can contaminate an average reference. Remove it from the average, or read the page on a bipolar montage, where the artifact stays in the channels that contain T7.
Montage practice: change the reference

In the bipolar chain, T7 is input 2 in F7–T7 and input 1 in T7–P7, so those two channels deflect in opposite directions. Against the average, every channel has the same input 2, so you compare sizes instead: T7 is largest. Because the average includes the spike itself, the farthest electrodes can deflect slightly the other way.
The bipolar shared-electrode reversal mechanism needs adjacent channels sharing one electrode at opposite amplifier inputs. Referential channels share the average at Input 2. The bipolar reversal mechanism disappears, but the field can still contain positive and negative regions.
Spot check Compare the two views of the same field. What changes when the event is re-read against one reference?
Distinguish bipolar reversal logic from opposite polarities across a field. Each referential channel is electrode − reference. The reference is shared at Input 2. A two-lobed field or an active reference can produce opposite-signed deflections; the bipolar shared-electrode rule does not apply to those rows.
In bipolar, compare adjacent channel deflections. In referential, compare signed amplitudes across neighboring electrodes. Both views help describe the scalp field relative to the chosen inputs.
Use both views: bipolar subtraction can hide a broad field, while activity in a shared reference changes every referential channel.
Choosing which voltages to compare is the montage decision. The next two lessons add the transverse and circumferential chains and then put the four montage families side by side; display settings, which decide how those differences appear on the screen, come after that in Filters & sensitivity.
Transverse and circumferential montages
Longitudinal chains run front to back, so they leave two gaps: a focus at a chain end has only one neighbor, and, without a midline chain, a midline focus is split across left and right chains. Transverse rows run left to right, so a midline field can sit inside a single chain. Circumferential closes the rim into a ring, giving occipital and frontopolar sites neighbors on both sides. Both layouts still use the same 10–20 array.
Read the EEG labels, then follow the map
Clinical page (first half) · select to see the full page
- Frontopolar
- Frontal
- Central
- Parietal
- Occipital
- Left
- Anterior
- Right
- Posterior
- Parasagittal
Montage layout
A shared-electrode reversal needs the maximum inside a chain, with a neighbor on each side.
Spot check A surface-negative sharp transient is maximal at Cz, and the longitudinal display in use has no midline chain. Which montage shows it as a phase reversal within one chain?
Choose the montage that puts the maximum inside a chain. Transverse chains give midline electrodes a neighbor on each side; a circumferential ring does the same for the frontopolar and occipital electrodes at the rim.
One discharge, four montages
A montage chooses which electrode voltages to subtract. The same discharge can appear differently across montages, so compare more than one arrangement.
In this model, each montage is calculated from the same scalp field. Switching views changes the channel comparisons; the source stays in place.
left temporal over right temporal, then left parasagittal over right parasagittal; no midline chain
Row labels on the longitudinal montage: LT and RT mark the left and right temporal chains, LP and RP the left and right parasagittal chains.
Field variants, reference options, and voltage table
Fixed linear voltage scale with a 50 µV calibration marker. The scalp field is illustrative and does not change when you switch montage. An active reference changes referential channels; it cancels from bipolar differences.
The same right temporal sharp wave on four real pages. Switch montage; the generator does not move.
Clinical page, windowed on the discharge (select it to open the full page)
- Frontopolar
- Frontal
- Central
- Parietal
- Occipital
- Left
- Posterior
- Right
- Anterior
Montage layout
Electrode minus average. Every channel shares Input 2. Opposite polarities may occur, but they do not follow the bipolar shared-electrode reversal rule.
Read amplitudes. Compare signed amplitudes and neighboring gradients to identify the scalp field maximum relative to this reference. Here, F8–Avg and T8–Avg stand above their neighbors.
Watch the reference. One bad electrode contaminates the average and can ghost across every other channel.
Try the occipital example. O1 is at the end of the longitudinal chain. In the circumferential ring it has neighbors on both sides, allowing its field to produce a complete shared-electrode reversal.
Find a chain in which O1 has a neighbor on each side.
Spot check A surface-negative sharp wave is maximal at O1. On the longitudinal montage it deflects in P7–O1 and P3–O1, with no reversal. Which montage can show the reversal at O1?
An electrode at the end of every chain needs a different chain. The circumferential ring gives the occipital and frontopolar electrodes neighbors on both sides; the generator has not moved, only the comparisons have.
Which channels contain the reference as an input, and which do not?
Spot check On a referential montage, the shared reference electrode itself picks up a discharge at −60 µV. How does this change the display?
Know what your reference records. An active reference adds an opposite-signed copy of its own voltage to every referential channel, so electrodes far from the discharge can appear to deflect. Check the same event on a bipolar montage, where the reference cancels.
Filters and sensitivity
Start with a normal EEG background plus slow drift, fast noise, and 60 Hz interference. Change one control at a time to reveal each artifact; sensitivity changes only its displayed height.
Normal background with artifacts in the source. Lower LFF to 0.1 Hz for slow drift, raise HFF to 150 Hz for fast noise, or turn the notch off for 60 Hz interference.
Synthetic normal background, 10 seconds. Slow drift: 0.18–0.32 Hz; fast noise: 125–190 Hz; line interference: 60 Hz. Both views use the same sensitivity and time scale. On small screens, scroll across the trace. Row labels: LT and RT mark the left and right temporal chains.
How to read the controls
LFF is a high-pass filter: 1 Hz reduces the slow drift in this example. HFF is a low-pass filter: 70 Hz reduces the fast noise. Neither cutoff is a brick wall, so some artifact can remain. These artifacts occupy separate bands to make the controls easy to learn; real muscle artifact also overlaps brain frequencies. Filters can attenuate useful brain activity too.
Notch: reduces activity near 60 Hz, including any brain signal in that band. Troubleshoot electrode contact and interference before relying on it. Read about digital EEG filters.
Sensitivity: divide voltage by µV/mm to find height on the teaching grid. A 70 µV wave occupies 10 mm at 7 µV/mm and 5 mm at 14 µV/mm. These are calibrated display units, not physical screen millimeters.
What each setting keeps
The low-frequency filter is a high-pass filter. Does it know which slow activity is artifact?
Spot check A patient with a left temporal lesion has continuous focal delta activity at 1–2 Hz, and the page also drifts with sweat. A reader raises the low-frequency filter from 1 Hz to 5 Hz. What is the risk?
Filters attenuate brain activity as well as artifact. Correct the cause of an artifact where possible; when a filter must be changed, remember that activity slower than a low-frequency filter’s setting, or faster than a high-frequency filter’s, is reduced on the display, cerebral activity included.
Troubleshoot before filtering
Use channel distribution to identify the shared bad electrode, correct the contact or environmental source, and only then adjust the display. These two checks apply that sequence.
Shared-electrode rule: list the noisy channels, find the electrode they have in common, then confirm that electrode appears in no clean channel. This distribution favors a shared electrode or its input; hardware faults need not affect every channel.
Spot check Two channels on this page are buried under a 60 Hz buzz and the rest are clean. The affected pair is Fp1–F7 and F7–T7. Which electrode is the problem?
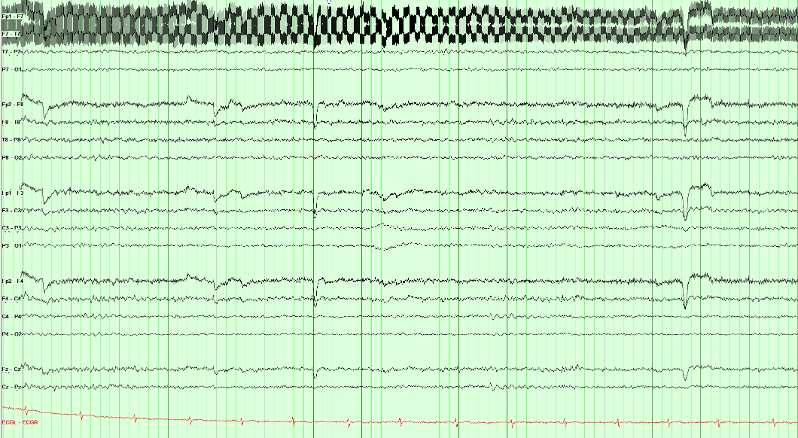
Find the electrode the noisy channels share, and check it appears nowhere clean. Fp1–F7 and F7–T7 both contain F7; Fp1 also sits in a clean Fp1–F3 and T7 also sits in a clean T7–P7. Only F7 is implicated by every channel it touches. A loose or drying F7 contact with high impedance is a likely explanation. Confirm with contact and impedance checks; the waveform alone does not prove the cause.
Check F7 contact and its lead, reduce nearby interference, and reassess. A notch may reduce residual 60 Hz activity, but it does not repair the contact and also attenuates signal near that frequency.
This is the general rule for localizing any single-electrode problem, including hum, an electrode pop, or a flat channel: list the channels that show it and take the electrode they have in common.
Sweat artifact lives below about 0.5 Hz and is often largest frontally. The low-frequency filter can attenuate it on the display, but re-gelling and cooling fix the source. A notch filter targets mains frequency, not baseline sway.
Spot check A different technical problem: the baselines on this page are swaying slowly, well below 1 Hz, and the sway is largest frontally. Which setting can attenuate it on the display while you correct the cause?
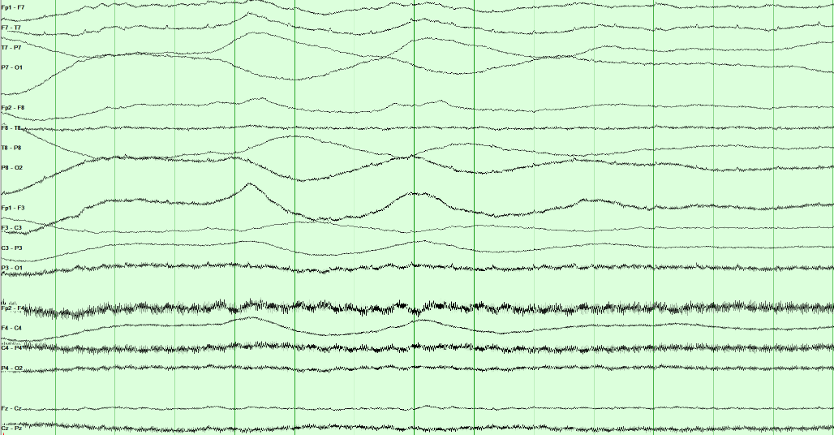
Sweat artifact occupies the lowest frequencies, so the low-frequency filter can attenuate it on the display. Sweat and slow changes in skin potential often produce sway below about 0.5 Hz. Raising the low-frequency filter modestly may improve readability, but it can also attenuate genuine cerebral delta.
Address the source: cool the patient and dry the scalp as appropriate. Then reassess the trace. Excessive low-frequency filtering can hide cerebral slowing along with sweat artifact.
Muscle artifact contains broad-band activity, including fast components. Lowering the high-frequency filter may reduce it but can also blunt cerebral sharp waves.
Digital recording: what is retained
The analog signal and sampling rate determine what a digital EEG retains. Display settings cannot restore removed frequencies, clipped voltages, or information lost through aliasing.
Acquisition chain
What acquisition preserves
The signal passes through a differential amplifier and an analog anti-alias filter before analog-to-digital conversion (ADC). Display processing then operates on those stored samples.
Still analog
-
1
Differential amplifier Input 1 minus Input 2. Common-mode interference is rejected here, not later on the screen.
-
2
Analog anti-alias filter A low-pass that must act before sampling. It attenuates frequencies that could alias at the selected sampling rate.
Already a file
-
3
Digital filtering and display Low- and high-frequency filters, notch, sensitivity, and montage reformatting. Review filters change the view of retained original samples. Processing that overwrites or discards data cannot be undone.
Information that cannot be recovered
- Content the analog anti-alias filter already removed
- The true frequency of an aliased oscillation
- Headroom, if the converter saturates
Settings you can change during review
- Display low- and high-frequency filters and notch
- Sensitivity, paper speed, and montage
- Review filters when the original samples were retained
Can the samples preserve the signal?
The gray curve is a 60 Hz signal; blue dots are the stored samples. Sampling does not have to land on each peak. It needs a rate above twice the highest retained frequency, with anti-alias filtering before sampling. Select 120 Hz: the dots start at the zero crossings, so the recorded values are all zero. Then move the phase slider to see why exactly two samples per cycle is unreliable.
True 60 Hz Stored samples, joined for display Wave the samples imply
Impedance is a pattern, not one number
Routine electrode–skin impedances are ordinarily kept at or below about 5 kΩ and reasonably balanced. A near-zero value suggests a salt bridge. A high or mismatched contact weakens common-mode rejection. Trace a disturbance through every channel sharing the electrode before blaming the amplifier.
Electrical safety
Use approved isolated EEG equipment, hospital-grade grounded outlets, intact short leads, and one common patient ground according to local policy. Never create extra paths to ground through other appliances. Stop to investigate damaged cables, unexpected shocks, or equipment faults.
Check acquisition first. Inspect the patient, electrodes, environment, and analog signal before adjusting display filters.
Sampling must exceed twice the highest frequency present. Is 200 samples per second enough for 150 Hz?
Spot check Muscle activity at 150 Hz is recorded at 200 samples per second without adequate anti-alias filtering. What does review show, and can it be fixed?
Acquisition sets what is kept. The analog anti-alias filter must act before sampling, and the sampling rate must exceed twice the highest retained frequency. Display filters, sensitivity and montage change only the view of what was stored.
With the acquisition chain understood, the next step is learning the frequency and amplitude language used to describe the recorded waveforms.
Frequency: the four primary bands
Interpretation foundation
EEG: A Language of Its Own
Every tracing begins with frequency, the number of cycles per second in hertz, and amplitude, the voltage difference in microvolts. Those measurements become meaningful only after you add location, morphology, state, symmetry, and reactivity.
Describe frequency in hertz, then add amplitude, location, and state. These examples use the same sensitivity and illustrate decreasing amplitude as frequency increases.
Band edges follow the usual convention: 8 Hz is alpha, not theta, and 13 Hz is still alpha, not beta; beta begins above 13 Hz. Amplitude decreases automatically as you increase frequency. You can adjust voltage separately; changing frequency restores the example amplitude.
Frequency does not require a particular voltage. To compare bands at equal amplitude, select a frequency and then adjust its voltage. A posterior dominant rhythm also requires the appropriate location, state, and reactivity.
Background reactivity: The posterior dominant rhythm normally attenuates with eye opening. Reactivity is interpreted alongside state, medications, technique, and the rest of the recording; absent or reduced reactivity can be concerning but is not diagnostic in isolation.
Convert to cycles per second first, then check the band edges: 8 Hz and 13 Hz both belong to alpha.
Spot check An awake adult’s occipital rhythm completes 26 cycles in 2 seconds and attenuates with eye opening. Which band is it in?
Count, then name. Frequency is cycles per second: 8 Hz is alpha, not theta, and 13 Hz is alpha, not beta. Location, state and reactivity then decide whether an alpha-frequency rhythm is the posterior dominant rhythm.
Amplitude and voltage scales
Amplitude is measured in microvolts (µV). Sensitivity, in µV/mm, determines display height: a lower setting makes the same signal taller; a higher setting makes it shorter. The lab measures peak-to-peak amplitude.
Calibrated display lab
Separate voltage from display height
Change the selected voltage, then change sensitivity. Compare all three signals at the same display scale.
Each small grid square represents 5 mm on this teaching display. Brackets measure peak-to-peak height; these are not physical screen millimeters.
Amplitude changes when the underlying voltage changes.
Sensitivity changes only how tall every signal looks on screen.
Review display standards in Recording technique.
Intracranial vs. Scalp Voltages: Potentials recorded directly from the cortical surface are substantially larger than those at the scalp, often by roughly one to two orders of magnitude. Volume conduction through cerebrospinal fluid, skull, and scalp both attenuates and spatially blurs the signal, which is why an intracranial electrode can resolve a discharge that the scalp never registers.
Voltage is height multiplied by sensitivity. Changing the sensitivity changes only the height.
Spot check At a sensitivity of 7 µV/mm, a posterior rhythm measures 10 mm peak to peak. The reader changes the sensitivity to 10 µV/mm. What is its amplitude, and how tall does it now look?
Sensitivity is microvolts per millimeter. Voltage = height × sensitivity, so a lower setting makes the same signal taller and a higher setting makes it shorter. Report amplitude in microvolts, never in display height.
Phases, morphology, and rhythmicity
Describe a waveform with both measurements and words: frequency, amplitude, phases, shape, and repetition. Interpret those features together with its field and the patient’s state.
Phases: count the crossings
A phase is one excursion to one side of the baseline. You count phases by counting baseline crossings, not peaks; a wave with three phases crosses twice. Spikes and sharp waves are usually diphasic or triphasic; a discharge with many phases is polyphasic.
Three phases and “triphasic morphology” are not interchangeable. The American Clinical Neurophysiology Society (ACNS) uses triphasic morphology as a specific modifier, commonly in generalized periodic discharges (GPDs). Count phases first, then assess the full waveform pattern and distribution.
One wave, or a run of them?
Polymorphic activity varies in shape from wave to wave. Monomorphic activity has a relatively uniform shape. Next, assess whether the waves repeat with a regular interval.
For ACNS rhythmic or periodic terminology, a pattern must continue for at least six cycles. The key distinction is the interval between waves:
- Periodic: discrete discharges with a measurable interval between the end of one and the start of the next.
- Rhythmic: each wave runs straight into the next, with no interval at all.
Current ACNS terminology does not use the older quasi-periodic or quasi-rhythmic modifiers. A pattern remains periodic or rhythmic when cycle length varies by less than 50% across most consecutive cycle pairs; greater variation falls outside those labels.
Build the name in two steps: describe the distribution (for example, lateralized or generalized), then the pattern (periodic discharges or rhythmic delta activity). Add the relevant modifiers afterward.
Count baseline crossings, not peaks: each crossing starts a new phase.
Spot check A sharp wave leaves the baseline, crosses it twice, and then returns to it. How should its phases be described?
Count crossings, not peaks. A wave with three phases crosses the baseline twice. State the number of phases first, then decide separately whether the whole pattern has triphasic morphology.
Look at what lies between the discharges: an interval, or none?
Spot check Over the left hemisphere, sharp discharges lasting about 200 ms recur once per second for 20 seconds, each separated from the next by background activity. How is the pattern named?
Name the distribution, then the pattern. An interval between discrete discharges makes a pattern periodic; no interval makes it rhythmic. Six cycles are enough to use either term.
Background organization: continuity, symmetry and gradient
Start with the background before looking for isolated events. A record can be abnormal without any epileptiform discharges. Work through these four questions in order:
- State: Awake, drowsy, or asleep? Everything else is judged against the answer.
- Organization: Continuous, symmetric, and does it have an anterior–posterior gradient?
- Posterior dominant rhythm: Present, in range, and symmetric; does it react?
- Variability and reactivity: Does the tracing change on its own, and change when you stimulate?
Use the three comparisons below to judge organization before measuring the posterior rhythm or interpreting individual transients.
Continuity
Look for sustained lower-voltage intervals interrupting the background. Interpret them with age, state, medications, and recording quality. Premature neonatal discontinuity has a different maturational meaning.
At the same montage and scale, identify lower-voltage intervals. Measure their duration and proportion before assigning a continuity category.
Symmetry
The two hemispheres should broadly match in amplitude and frequency. Compare homologous chains, not a single channel against memory.
A persistent left–right difference deserves closer review. Compare frequency and voltage across homologous regions, and check technique, state, and skull-related effects.
Anterior–posterior gradient
In a relaxed, awake adult, anterior activity is usually faster and lower in amplitude than the posterior rhythm. Assess this gradient with the eyes-closed background.
An indistinct gradient can reflect reduced organization, but also changes in arousal, medication effects, or technique. Interpret it with the rest of the background.
In a relaxed, awake adult, anterior activity is faster and lower in amplitude than the posterior rhythm. Compare front with back, not left with right.
Spot check A relaxed, awake 45-year-old is recorded with the eyes closed. For minutes at a time the frontal channels carry slower, higher-amplitude activity than the occipital channels. Which part of background organization is abnormal?
The anterior–posterior gradient is lower-voltage, faster activity in front and higher-voltage, slower activity behind, persisting for at least a minute. The same arrangement from back to front is a reversed gradient (Hirsch 2021).
A lost or reversed gradient can reflect reduced organization, but also drowsiness, medication, or technique. Establish the state first, then read the gradient with the rest of the background.
The posterior dominant rhythm
The posterior dominant rhythm (PDR) is a reactive occipital rhythm in an awake person with the eyes closed. Alpha names a frequency band. PDR names a finding with a location, behavioral state, and response to eye opening. Follow the complete longitudinal bipolar page before measuring it.
10-second longitudinal bipolar page
Watch the PDR appear, settle, and attenuate
The posterior temporal and parasagittal derivations are highlighted only when the finding is established.
Count the stable left posterior rhythm, compare the right, then check eye-opening reactivity. Select a count and choose Check answer.
Row labels: LT and RT mark the left and right temporal chains, LP and RP the left and right parasagittal chains.
Count the cycles
At Stable PDR, how many cycles of the left posterior rhythm (P7–O1 and P3–O1) fit between the green lines?
The bracket spans one second, so the cycle count equals the frequency in Hz.
Clinical page (first half)

Where to measure
Occipital maximum. After the mixed-frequency stretch on the left, a regular posterior alpha rhythm appears and stays maximal at O1/O2.
Measure a stable segment. Use the green one-second bracket in the model above. On the separate clinical page, use its own time markings to estimate frequency.
Still normal. Assess frequency together with posterior distribution, symmetry, state, and eye-opening reactivity.
Continue with the maturation of the posterior dominant rhythm in From preterm to adolescence and normal lookalikes in Normal variants that look epileptiform.
Measurement traps and adult asymmetry thresholds
Alpha squeak: the first second after eye closure may briefly run faster. Measure the stable awake segment that follows.
Drowsiness: the rhythm may look clearer but slow as arousal falls. Use the best awake sample.
Reactivity: attenuation with eye opening helps establish that the posterior rhythm is a PDR.
| Measure | Expected adult finding | Concerning difference |
|---|---|---|
| Frequency | 8.5–13 Hz in an awake adult | Below 8.5 Hz while fully awake |
| R vs L frequency | Within 1 Hz | Persistent difference greater than 1 Hz |
| R vs L amplitude | Right often a little higher | Persistent difference beyond about 50%, or a clearly higher left; the lower side is usually the abnormal one, unless a skull defect has raised the other |
Measure each side on a stable awake, eyes-closed stretch, then compare the two sides. Each side can be within the normal range and still differ from its partner.
Spot check On repeated measurements, an awake adult with the eyes closed has a reactive posterior dominant rhythm of 10.5 Hz on the right and 9 Hz on the left. How should the rhythm be described?
Read the posterior dominant rhythm in three steps: the frequency of each side, the left–right comparison, then attenuation with eye opening. A persistent frequency difference greater than 1 Hz between the hemispheres is a marked asymmetry (Hirsch 2021).
Before calling it, exclude a drowsy sample on one side and technical causes, then look for other asymmetries in the background, such as focal slowing.
Variability, reactivity, and state
Sedation, temperature, and impaired arousal can reduce variability and reactivity. In critical illness, interpret these findings with the full clinical assessment and other prognostic tests.
Provoke it
Interpret by wake–sleep state
Identify wakefulness, drowsiness, or sleep before interpreting slowing. Persistent delta in a fully awake adult has a different meaning from delta during N3 sleep.
Age-related findings not to over-read
| Finding | What it is |
|---|---|
| Posterior slow waves of youth | 2.5–4.5 Hz mixed into the posterior rhythm in children and adolescents, attenuating with eye opening |
| Slow / fast alpha variant | Half or double the alpha frequency; both react like alpha, and that reactivity is what identifies them |
| Benign temporal slowing | Scattered temporal theta or delta in the elderly |
Reactivity is a change in the cerebral background when you stimulate. The stimulus often adds artifact; that does not count.
Spot check An intensive care patient off sedation has continuous diffuse delta. Voice and a sternal rub bring temporal muscle artifact and frontal blinks; the delta beneath is unchanged. How is reactivity reported?
Reactivity is a change in cerebral EEG activity to stimulation, in voltage or frequency, including attenuation; the appearance of muscle activity or eye blink artifact does not qualify. Before calling a record unreactive, a second round of standardized noxious stimulation is suggested, and sedatives or paralytics belong in the impression (Hirsch 2021).
Variability and reactivity are both judged on the cerebral background. Sedation, temperature, and impaired arousal reduce both.
Practice: assess the adult background
Apply the four background questions from the pages above: organization, posterior dominant rhythm, reactivity, then state. The technologist has already told you this patient is awake with eyes closed and not drowsy. Read the posterior chains for the rhythm, not the frontal muscle.
Judge continuity, symmetry, and slowing on the posterior background. Frontal muscle is fast and can make a slow record look normal if you read the wrong place.
Spot check This is a fully awake adult during sustained eyes-closed recording; drowsiness has been excluded. You have run the four background questions on the page. How would you describe it? (There is muscle on the frontal channels; read past it.)
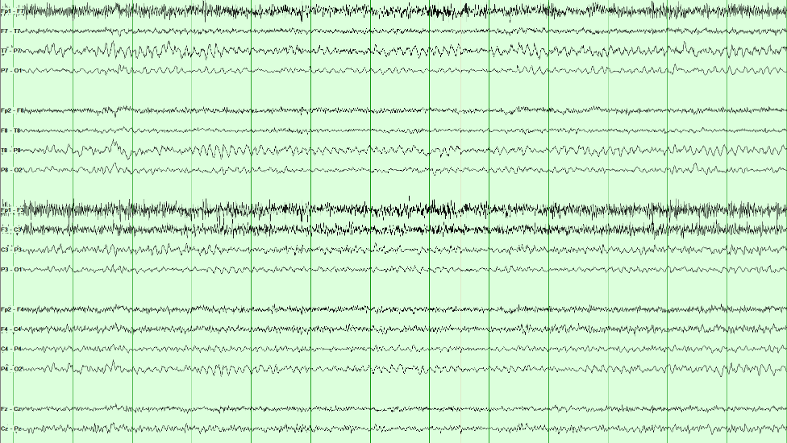
Diffuse, symmetric, continuous slowing. The background is theta-dominant across the page rather than alpha-dominant posteriorly, both hemispheres look alike, and there are no periodic or rhythmic runs. That combination is mild diffuse slowing, the commonest abnormal EEG finding there is.
It is non-specific on its own. Diffuse slowing says cerebral function is abnormal in this known-awake adult; it does not say why. Toxic, metabolic, postictal, infectious, and degenerative processes may look like this. If behavioral state were unknown, drowsiness could mimic the appearance and would have to be excluded before calling it abnormal.
Frontal muscle activity can obscure the slower cerebral background in this example. Use the less contaminated posterior regions to assess its dominant frequency.
The PDR is an occipital rhythm in an awake person with eyes closed. After a mixed opening, measure frequency and symmetry at O1 and O2, not through frontal artifact.
Spot check Awake adult. After a mixed-frequency stretch the eyes close and a regular rhythm appears. Read the channel labels: where on this page is that rhythm largest?
The PDR is an occipital rhythm. After the first seconds of mixed activity, a regular alpha-range oscillation appears and stays maximal at O1 and O2. Measure it there, on the stable eyes-closed stretch, not through the frontal muscle.
Frequency, symmetry, and reactivity are the three questions that follow. Count cycles in a one-second bracket on the posterior channels; compare left with right; then confirm that eye opening attenuates it.
How normal EEG changes with age
The adult rules in this course are not universal across development. Interpret pediatric and neonatal EEG against postmenstrual age in neonates, chronological age in older children, behavioral state, and sleep–wake organization before calling slowing or discontinuity abnormal.
Pediatric PDR maturation
| Approximate age | Expected milestone |
|---|---|
| ~4 months | Posterior rhythm around 4 Hz |
| ~1 year | Posterior rhythm around 6 Hz |
| ~3 years | Posterior rhythm around 8 Hz |
| Adolescents and adults | About 10 Hz (normal adult range 8.5–13 Hz) |
Sleep spindles appear at roughly 6–8 weeks and may remain asynchronous until about 2 years. Posterior slow waves of youth can be normal when they remain tied to the reactive posterior rhythm.
Neonatal preview
In neonates, state and continuity are maturational variables. Tracé discontinu is expected at very premature ages; delta brushes peak before term; tracé alternant belongs to term quiet sleep; and wakefulness/active sleep should become continuous by term. A pattern normal at 29 weeks postmenstrual age may signal severe dysfunction in an adult.
This is orientation, not neonatal interpretation training. Continue to From preterm to adolescence, Reading a neonatal EEG and Neonatal seizures in Board Review for age-specific patterns, recording standards and neonatal seizures.
Judge the posterior rhythm against age before calling it slow: the adult range applies from adolescence.
Spot check A healthy, developmentally typical 1-year-old is recorded awake with the eyes closed. A 6 Hz occipital rhythm attenuates when the eyes open. How should it be read?
Interpret every background against age before calling it slow. The posterior rhythm is about 4 Hz at 4 months, 6 Hz at 1 year and 8 Hz at 3 years, and about 10 Hz in adolescents and adults. In neonates, continuity and state are judged against postmenstrual age.
Recognizing sleep architecture
Recognize sleep architecture before classifying sharp transients. Non-rapid eye movement (NREM) sleep, staged N1 to N3, can activate epileptiform discharges; rapid eye movement (REM) sleep is staged separately. Normal sleep waveforms can also look sharp. The drawn pages share one time base and sensitivity, with the channels carrying the finding highlighted; the montage buttons re-derive the same field. N2 and N3 are recordings.
N1: light sleep
In people with a waking alpha rhythm, N1 begins as lower-amplitude mixed-frequency activity replaces it for more than half the epoch. Look for these supporting features:
- Vertex waves: brief, surface-negative sharp transients with a midline central maximum, usually near Cz.
- Slow rolling eye movements: gentle, slow horizontal oscillations.
Read the field: a vertex wave can produce reversals near C3 and C4 in longitudinal bipolar channels. Those reversals reflect the sampled field and do not establish two separate generators.
Compare montages: select Transverse to include Cz in the central chain. A reversal there better demonstrates the midline maximum. Localization depends on electrode coverage as well as subtraction.
N2: spindles and K-complexes
Recognize two characteristic N2 waveforms:
- Sleep spindles: 11–16 Hz runs, usually 12–14 Hz, lasting at least 0.5 seconds and typically largest centrally.
- K-complexes: a distinct negative sharp component followed by a positive component, with total duration at least 0.5 seconds and a frontal maximum. They may follow a stimulus.
Recognition clues: A K-complex is a sharp negative followed by a slow positive, and a spindle is a brief 11–16 Hz waxing-and-waning run. Their state-appropriate morphology, distribution, and relationship to the surrounding sleep architecture identify them; lack of evolution alone does not exclude every electrographic seizure.
N3: slow-wave sleep
Deep NREM sleep. In adults, N3 is scored when slow-wave activity at 0.5–2 Hz and at least 75 μV measured over the frontal derivations occupies at least 20% of a 30-second epoch. Other activity may still be present; spindles can occur and are not scored separately from the N3 epoch.
Recognition clues: The delta is generalized but frontally maximal; a completely uniform field would cancel out in a bipolar chain and show nothing at all.
REM: rapid eye movement sleep
REM sleep has a low-voltage, mixed-frequency background, rapid eye movements, and reduced tonic chin electromyography (EMG). Brief muscle activity may still occur.
- Sawtooth waves: triangular 2–6 Hz waveforms, often central, that can precede rapid eye movements.
- Rapid eye movements: irregular conjugate movements producing prominent deflections in eye-sensitive channels.
Formal REM staging uses EEG, eye movements, and chin EMG together.
Recognition clues: The eye movements are rapid here, not the slow rolling drift of N1: each saccade is a near-vertical edge, and the left and right frontal chains are mirror images at the same instant. The sawtooth waves in Fz–Cz and Cz–Pz arrive just before each burst. There are no spindles, K-complexes or vertex waves.
Rapid eye movement (REM) sleep is staged from three signals together: a low-voltage mixed-frequency EEG, rapid eye movements, and low chin muscle tone.
Spot check Overnight, the record shows a low-voltage mixed-frequency background, bursts of sharp-edged eye movements mirror-imaged at F7 and F8, and triangular central waves before each burst. Chin muscle tone is low; there are no spindles. Which state is this?
REM sleep is staged from the EEG, the eye movements, and the chin electromyogram together. Sawtooth waves, triangular 2–6 Hz waves that are often central, can precede the bursts of rapid eye movements.
The eye movements separate it from N1: rapid saccades with near-vertical edges, mirror-imaged in the left and right frontal chains, rather than the slow rolling drift of drowsiness.
Sleep practice: stage and field
Use the sleep features as a checklist: spindles and K-complexes support N2; qualifying slow-wave activity supports N3; a midline central transient may be a vertex wave; a low-voltage background with rapid eye movements suggests rapid eye movement (REM) sleep. Confirm state and field before interpreting sharpness.
N2 is defined by what interrupts the background (K-complexes and spindles), not by the low-voltage mixed-frequency background alone.
Spot check A real sleep page, longitudinal bipolar. Which stage is this?

N2 is defined by what interrupts the background, not by the background itself. Between the transients this page is low-voltage mixed-frequency, which on its own is N1 or REM. What makes it N2 is the presence of K-complexes and spindles.
Recognize N2 deliberately: sleep can reveal IEDs, while K-complexes and vertex waves are frequent sources of overinterpretation. Compare the transient with the surrounding sleep architecture.
The discriminator is context and morphology. Vertex waves and K-complexes have expected sleep-stage timing, topography, and associated architecture. Interictal epileptiform discharges may be strongly activated by non-rapid eye movement (NREM) sleep or even appear only in sleep, so absence during wakefulness does not make a sharp transient benign. Look instead for a reproducible physiologic field, appropriate duration and morphology, an after-going slow wave, and disruption of the background.
Before asking how sharp a transient is, define its field: which chains carry it, which barely move, and whether the two sides do the same thing at the same instant.
Spot check Same idea, a different sleep page: one transient stands out. Click a chain on the left or right side of the head that carries its maximum.
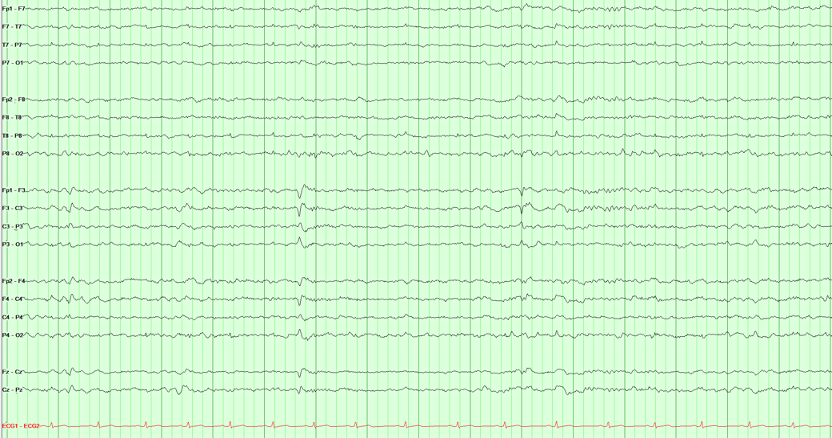
A vertex wave is a central, midline generator, so it appears on both sides at once. The two parasagittal chains carry it simultaneously and symmetrically, and the temporal chains hardly see it. That bilateral symmetry is the finding, not the sharpness.
This is a useful habit in reading sharp transients: before asking how sharp is it, define its field and relationship to state. A true interictal epileptiform discharge may be focal or generalized, so symmetry alone does not make a waveform benign. Here the expected midline maximum, bilateral parasagittal expression, sleep state, and morphology together support a vertex wave.
One vertex wave may be larger on one side. Assess asymmetry across repeated examples rather than classifying a single uneven transient.
N3 is scored from the background voltage, not from a single graphoelement. High-amplitude delta should occupy a substantial share of the epoch.
Spot check Another real sleep page, same longitudinal bipolar layout. Which stage is this?

N3 classification uses the whole epoch: qualifying slow-wave activity must occupy at least 20% of a 30-second adult epoch. This excerpt illustrates the high-voltage, frontally prominent delta to look for; confirm the duration on the full recording.
Spindles may still appear in N3 and are not scored separately. What you should not do is call this N2 because you can still find a spindle, or call it abnormal awake delta. State first, then the voltage makes sense.
Recognizing normal variants
Normal variants can be mistaken for interictal epileptiform discharges. Compare their morphology, field, state, and effect on the background. The drawn pages share one time base and sensitivity, with the channels carrying the finding highlighted; the montage buttons re-derive the same field. The mu rhythm example is a recording.
Mu rhythm
Mu is an arch-shaped central rhythm in the alpha range. It attenuates with movement or the intention to move, most clearly over the hemisphere opposite the moving hand, rather than showing the usual eye-opening response of the posterior dominant rhythm.
Recognition clues: It lives over the central electrodes, not the occiput, and eye opening does not abolish it. Movement of the opposite hand is the test that separates mu from the PDR.
Wicket waves
Wicket waves are arch-shaped temporal waveforms, often in 6–11 Hz runs during drowsiness or light sleep. An isolated wicket can resemble a spike. Compare it with nearby runs and look for preserved background and no prominent after-going slow wave.
Recognition clues: They come in runs with no after-going slow wave, and the background runs on underneath. The lone wave at 3.9 s on the tracing looks like a temporal spike; the expanded strip below the page shows it has the same shape and size as every wave in the run beside it.
Small sharp spikes
Small sharp spikes, also called benign epileptiform transients of sleep (BETS), are brief, low-amplitude transients seen mainly during drowsiness and light sleep. They may be unilateral or independently bilateral, with a broad temporal field and no significant background disruption.
Recognition clues: brief duration, low amplitude, light-sleep context, and preserved background. A small slow component can occur; avoid an absolute “no slow wave” rule.
Rhythmic mid-temporal theta of drowsiness
Rhythmic Mid-Temporal theta of Drowsiness (RMTD). Runs of monomorphic, flat-topped temporal theta waves (5–7 Hz) lasting several seconds during drowsiness. Typical RMTD remains monomorphic, does not spread, sits in its characteristic drowsy temporal field, and has no clinical correlate.
Recognition clues: The characteristic notched temporal morphology, drowsy state, fixed rate and field, and preserved background support RMTD. Evolution would argue against it, but not every electrographic seizure must evolve.
Occipital sharp transients: same shape, different state
Positive occipital sharp transients of sleep (POSTS) occur in light sleep, often in runs. Lambda waves are similar surface-positive occipital transients during awake visual scanning. Use state and behavior to distinguish them.
Recognition clues: Surface positive. POSTS arrive in sleep, usually in trains. Lambda is isolated and tied to visual scanning. Use the Lambda button on the tracing to switch the page. When a patient is awake and looking around, call it lambda; when asleep, call it POSTS.
More variants, side by side
Ask where the rhythm is and what stops it: eye opening, or movement of the opposite hand.
Spot check An awake 30-year-old has an arch-shaped 9 Hz rhythm over C3. It persists when her eyes open and attenuates when she clenches her right fist. What is it?
Mu is identified by where it is and what stops it: an arch-shaped 7–11 Hz rhythm over the central electrodes that attenuates with movement, or the intention to move, most clearly over the hemisphere opposite the moving hand. Eye opening does not abolish it, which separates it from the posterior dominant rhythm.
An isolated wave that looks like a spike is judged against its neighbors: compare it with any runs at the same site.
Spot check A drowsy 60-year-old has one sharply contoured 7 Hz wave at T7, with no after-going slow wave and an undisturbed background. Minutes later, runs of identical arch-shaped waves appear at T7. What is the lone wave?
An isolated wicket wave is a classic overcall. Compare the lone wave with nearby runs at the same site: the same shape and size, drowsiness or light sleep, no prominent after-going slow wave and a background that runs on underneath point to a wicket wave, not a temporal discharge.
Variant practice: use state and morphology
Use the patient’s state, waveform polarity, distribution, and surrounding background to classify this example. Positive occipital sharp transients of sleep (POSTS) and lambda waves share a shape and differ by state.
Inspect the posterior transients, and the state the technologist documented, before choosing a label.
Spot check The technologist documents stable N1–N2 sleep with the eyes closed and no visual scanning. Sharply contoured transients appear over the posterior head. What are they?
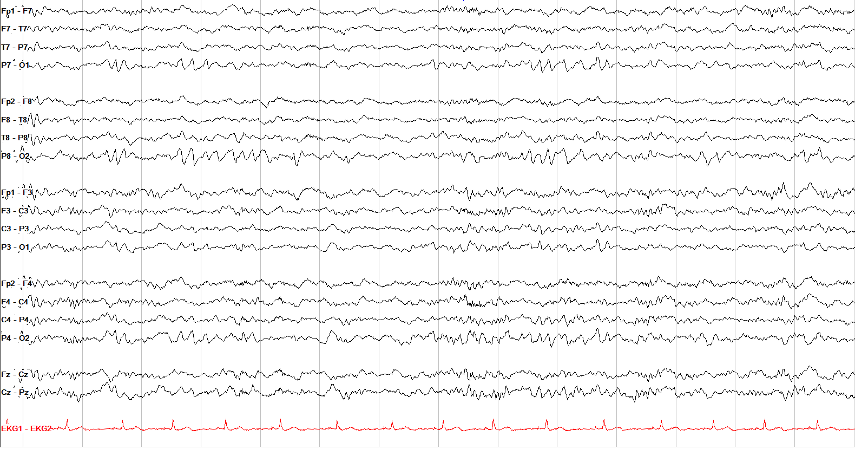
POSTS are normal occipital sleep transients: sharply contoured, surface-positive, often bilateral, and frequently seen in short runs.
Use the expected positive occipital morphology, sleep state, and surrounding background to recognize POSTS. Epileptiform discharges can also occur in sleep and in runs, so those features alone are insufficient.
Lambda waves have a similar occipital positive contour during awake visual scanning. Confirm the behavioral state and timing rather than naming the waveform from shape alone.
Interictal epileptiform discharges
An interictal epileptiform discharge (IED) is a transient with a plausible cerebral field, not simply a pointy waveform. Measure duration first: an EEG spike is 20–70 ms, while a sharp wave is 70–200 ms. Then ask whether the event has a reproducible field, an appropriate phase relationship across channels, a common after-going slow wave, and disruption of the surrounding background. No single feature is mandatory or diagnostic by itself.
Review the same event in three views: identify its morphology, inspect the average-reference field, then compare a second bipolar montage. Follow the actual channel labels in each view.
Select a view to begin.
- Duration: Measure at the baseline crossings instead of judging sharpness by eye.
- Field: Confirm a plausible voltage gradient across neighboring electrodes on more than one montage.
- Context: Decide whether the transient belongs to sleep architecture, artifact, a benign variant, or an abnormal background.
- Repeatability: Find the same morphology and field again before diagnosing from an ambiguous transient.
Where the spike and the slow wave come from
Intracellular recordings from experimental epileptic foci explain the shape of an interictal discharge. During the spike, many neurons in the focus undergo a paroxysmal depolarization shift together: a large depolarization carrying a burst of action potentials, driven by glutamate receptors and voltage-gated Ca²⁺ channels. The after-going slow wave coincides with the hyperpolarization that follows, carried by GABA-mediated inhibition and Ca²⁺-activated K⁺ currents. When that hyperpolarization fails, discharges can merge into a seizure; see Two pathways to an electrographic seizure.
Measure at the baseline crossings: a spike lasts 20–70 ms, a sharp wave 70–200 ms. Both can be epileptiform.
Spot check A right temporal transient lasts 120 ms at its baseline crossings, is followed by a slow wave, disrupts the background, and recurs with the same field over F8, T8 and P8. How is it named?
Duration names the waveform: a spike lasts 20 to under 70 ms and a sharp wave 70 to 200 ms, measured at the baseline (Hirsch 2021, following the International Federation of Clinical Neurophysiology glossary). Whether it is epileptiform rests on the other features: a plausible, reproducible field, an after-going slow wave, and disruption of the background. No single feature is mandatory.
The spike and the slow wave come from opposite events in the same neurons.
Spot check In an epileptic focus, many neurons fire together during an interictal spike. What happens in those neurons during the after-going slow wave?
The spike reflects the paroxysmal depolarization shift: a large depolarization with a burst of action potentials in many neurons at once, driven by glutamate receptors and voltage-gated Ca²⁺ channels. The after-going slow wave reflects the hyperpolarization that follows, carried by GABA-mediated inhibition and Ca²⁺-activated K⁺ currents. When that hyperpolarization fails, discharges can merge into a seizure.
Continue with Interictal epileptiform discharges and Semiology: localizing and lateralizing in Board Review.
Idiopathic generalized epilepsies on EEG
The four idiopathic generalized epilepsy syndromes, childhood absence epilepsy, juvenile absence epilepsy, juvenile myoclonic epilepsy and epilepsy with generalized tonic–clonic seizures alone, share a normal background and generalized spike-and-wave at 2.5–5.5 Hz (Hirsch 2022). Epilepsy with eyelid myoclonia, a generalized epilepsy of childhood, shares the normal background (Specchio 2022). What separates them on the record is the discharge itself and what brings it out.
Frequency, morphology and the trigger
Read three things in any generalized discharge: its frequency and how regular it is, whether each slow wave carries one spike or several (polyspike-and-wave), and what provoked it. Then check the background, which should be normal in all of these syndromes.
- Childhood absence epilepsy (onset typically 4–10 years, range 2–13): paroxysms of 3 Hz generalized spike-and-wave, range 2.5–4 Hz, regular in the first second of an absence. Absences typically last 3–20 s, median 10 s. Generalized spike-and-wave and absences are both provoked by hyperventilation in most untreated patients, and if an untreated child hyperventilates well for 3 minutes without generalized spike-and-wave, childhood absence epilepsy can be excluded. Photic stimulation triggers generalized spike-and-wave in 21%. Polyspike-and-wave appears only in drowsiness and sleep (Hirsch 2022).
- Juvenile myoclonic epilepsy (onset typically 10–24 years, range 8–40): irregular generalized polyspike-and-wave and spike-and-wave at 3–5.5 Hz, awake and asleep. Myoclonic seizures, mandatory for the diagnosis and most common in the first hour after awakening, are associated with a generalized polyspike-and-wave discharge. Sleep deprivation brings the discharges out, and a photoparoxysmal response is seen in more than one third. An awake record can be normal in an untreated patient; a recording after sleep deprivation usually shows generalized spike-and-wave (Hirsch 2022).
- Juvenile absence epilepsy and epilepsy with generalized tonic–clonic seizures alone: generalized spike-and-wave, usually 3–4 Hz in juvenile absence epilepsy, within 3–5.5 Hz in both (Hirsch 2022).
- Epilepsy with eyelid myoclonia (peak onset 6–8 years, range 2–14): brief bursts of fast, 3–6 Hz, irregular generalized polyspike-and-wave. Fixation-off sensitivity, induced by eye closure, and photic stimulation activate them. The eyelid myoclonia, rhythmic 3–6 Hz jerks of the eyelids, typically last under 1 to 3 s and always under 6 s (Specchio 2022).
| On the record | Points toward |
|---|---|
| Regular 3 Hz spike-and-wave with an absence, brought out by hyperventilation | Childhood absence epilepsy |
| Irregular 3–5.5 Hz polyspike-and-wave, brought out by sleep deprivation or intermittent photic stimulation; a polyspike with each jerk | Juvenile myoclonic epilepsy |
| Fast 3–6 Hz polyspike-and-wave on eye closure, with eyelid jerks | Epilepsy with eyelid myoclonia |
| Slow spike-and-wave under 2.5 Hz, or diffuse slowing of the background | Against an idiopathic generalized epilepsy: neither belongs to any of the four syndromes |
Fragments in sleep
In sleep the generalized discharges often fragment, and a fragment can look focal or multifocal. A fragment keeps the morphology of the generalized discharge and is not consistently seen in one area, in childhood absence, juvenile absence and juvenile myoclonic epilepsy alike (Hirsch 2022).
In juvenile myoclonic epilepsy, focal or multifocal spikes and spike-and-wave discharges can be seen in up to 20% of patients, mostly over the frontal regions, and they may shift location from one recording to the next. What its definition lists as exclusionary is different: focal slowing, epileptiform abnormalities consistently on one side, slow spike-and-wave under 2.5 Hz (unless at the end of a faster burst), and diffuse slowing of the background outside the postictal period. A habitual myoclonic event recorded without polyspike or spike-and-wave also excludes juvenile myoclonic epilepsy (Hirsch 2022).
- Frequency: measure it in the first second of a burst; 3 Hz and regular, or 3–5.5 Hz and irregular.
- Morphology: one spike per slow wave, or a polyspike; and whether a jerk coincides with a polyspike.
- Trigger: name the hyperventilation, the intermittent photic stimulation, the eye closure or the sleep deprivation that brought it out.
- Background and fragments: a normal background; fragments that move, not a focus that stays.
The criteria for an epileptiform discharge are in Interictal epileptiform discharges, and the procedures that provoke these discharges in Activation procedures. Treatment by syndrome is in Medicines for epilepsy syndromes, in Seizure Management.
Frequency, regularity and the trigger name the syndrome; the background must be normal.
Spot check An 8-year-old has many brief staring spells a day. The background is normal. During hyperventilation a 10-second run of regular 3 Hz generalized spike-and-wave appears, and she stops counting and stares. Which syndrome does the record support?
In childhood absence epilepsy the ictal EEG is regular 3 Hz (range 2.5–4 Hz) generalized spike-and-wave, on a normal background, and hyperventilation provokes the discharge and the absence in most untreated patients (Hirsch 2022).
A normal awake record does not exclude juvenile myoclonic epilepsy.
Spot check A 16-year-old has jerks of both arms within an hour of waking, and one generalized tonic–clonic seizure after a night without sleep. A routine awake EEG with hyperventilation and photic stimulation is normal. What is the next EEG?
A normal awake EEG can be seen in some untreated people with juvenile myoclonic epilepsy, and a further recording after sleep deprivation usually elicits generalized spike-and-wave (Hirsch 2022).
Ask whether the focal-looking discharge stays in one place.
Spot check A 19-year-old with juvenile myoclonic epilepsy has an overnight recording. Awake there are bursts of generalized polyspike-and-wave. In sleep there are brief polyspike-and-wave discharges over the left frontal region, then over the right, with the same morphology as the generalized bursts. The background is normal. How should the sleep discharges be read?
In sleep the discharges of juvenile myoclonic epilepsy often fragment and can look focal or multifocal; they are mostly frontal and may shift location between recordings. Focal slowing or consistently one-sided epileptiform abnormalities would exclude the syndrome (Hirsch 2022).
Sources: Hirsch 2022, the ILAE definition of the idiopathic generalized epilepsy syndromes; Specchio 2022, the ILAE definitions of syndromes with onset in childhood.
Developmental and epileptic encephalopathies on EEG
In a developmental and epileptic encephalopathy, development is impaired both by the underlying cause and by the epileptic activity itself (Zuberi 2022). Here the EEG is part of the definition: burst suppression in the first months, hypsarrhythmia between epileptic spasms, the slow spike-and-wave and fast activity of Lennox–Gastaut syndrome, and spike-and-wave switched on by sleep.
Burst suppression and hypsarrhythmia
Early-infantile developmental and epileptic encephalopathy begins between birth and 3 months, and includes infants previously classified as Ohtahara syndrome and early myoclonic encephalopathy. Its EEG is burst suppression: high-voltage bursts of 150–300 µV of mixed spikes, sharp and slow waves lasting 1–5 s, alternating with marked suppression under 5 µV for 3–10 s (the threshold in this syndrome definition; the ACNS critical care terminology calls a background suppressed below 10 µV). It is usually present awake and asleep and does not change with stimulation. The alternative is multifocal spikes, spike-and-wave or sharp waves, with or without slowing or discontinuity, and in some infants either pattern evolves to hypsarrhythmia (Zuberi 2022).
Infantile epileptic spasms syndrome begins between 1 and 24 months, most often between 3 and 12, and includes West syndrome: the triad of epileptic spasms, hypsarrhythmia and developmental stagnation or regression. A spasm is a brief tonic contraction of axial muscles, typically under 3 s, flexor, extensor or mixed, usually in series or clusters and often on awakening (Zuberi 2022).
- Hypsarrhythmia is chaotic, high in amplitude and excessively slow, with multifocal epileptiform discharges. The yield is greatest when non-rapid eye movement sleep is recorded. Very early in the course, or in older children, it may be absent, and standard treatment should not be withheld for that reason.
- A spasm on the EEG is a high-amplitude generalized sharp or slow wave followed by low-amplitude fast activity, which may appear as a brief electrodecrement. Hypsarrhythmia typically attenuates or stops during a series of spasms.
- Electromyography helps to distinguish epileptic spasms from myoclonic and tonic seizures.
- A consistent focal discharge, or focal fast activity, suggests an underlying structural abnormality.
Lennox–Gastaut syndrome
In Lennox–Gastaut syndrome, which usually begins between 18 months and 8 years, tonic seizures are mandatory, with at least one other seizure type. The background is slow, with diffuse theta and delta that may be more pronounced focally. Two interictal patterns are mandatory (Specchio 2022):
- Generalized slow spike-and-wave: a spike (under 70 ms) or sharp wave (70–200 ms), then a negative high-voltage slow wave of 350–400 ms, bilaterally synchronous, often anterior predominant, at 2.5 Hz or slower. It is abundant, often in runs, and waxes and wanes without a clinical correlate, awake and particularly in sleep. Most patients no longer show the typical pattern after age 16.
- Generalized paroxysmal fast activity: bursts of diffuse or bilateral activity at 10 Hz or more, often in sleep, typically lasting a few seconds or less.
A tonic seizure begins with a diffuse decrement, then a burst of bilateral fast activity at 10 Hz or more that builds up in amplitude, a recruiting rhythm; polygraphy often shows a brief apnea with axial muscle contraction. Atypical absences go with slow spike-and-wave under 3 Hz, and ictal and interictal slow spike-and-wave can be hard to tell apart. Photic stimulation does not typically activate the discharges (Specchio 2022).
Spike-and-wave activation in sleep
In developmental and epileptic encephalopathy, and epileptic encephalopathy, with spike-and-wave activation in sleep, seizures begin between 2 and 12 years (peak 4–5), and the activation appears 1–2 years after seizure onset together with cognitive or behavioral regression or plateauing. Awake, the discharges are not continuous. Drowsiness and non-rapid eye movement sleep switch on slow, 1.5–2 Hz, spike-and-wave, markedly activated and usually diffuse, though it may be focal, typically frontal, or multifocal (Specchio 2022).
- No fixed threshold: the older term, electrical status epilepticus in sleep, required activity in more than 85% of slow-wave sleep, but lower percentages can also go with significant regression.
- A sleep recording is mandatory to confirm the diagnosis, and an overnight recording may be needed, since an outpatient sleep EEG may not reach slow-wave sleep.
- The pattern alone is not the syndrome: it leads to the diagnosis only with developmental plateauing or regression. Landau–Kleffner syndrome is a subtype, and self-limited epilepsy with centrotemporal spikes rarely evolves into it (Specchio 2022).
Continuity and suppression are named in Continuity, attenuation, and suppression; the self-limited epilepsy that can evolve to spike-and-wave activation in sleep is the next lesson, Self-limited focal epilepsies of childhood.
Between spasms, hypsarrhythmia; during a spasm, a large wave and then a decrement.
Spot check A 6-month-old has clusters of sudden flexion of the trunk and arms on waking. Between clusters the EEG is chaotic, high in amplitude and slow, with multifocal spikes. What does the EEG most likely show during each spasm?
The ictal EEG of a spasm is a high-amplitude, generalized sharp or slow wave followed by low-amplitude fast activity, which may appear as a brief electrodecrement; electromyography helps to distinguish spasms from myoclonic and tonic seizures (Zuberi 2022).
Lennox–Gastaut syndrome has two mandatory interictal patterns.
Spot check A 5-year-old has nightly tonic seizures and atypical absences. The awake EEG shows diffuse theta and delta with runs of bilateral, anterior-predominant spike-and-wave at 2 Hz. Which second pattern, best sought in sleep, completes the EEG criteria for Lennox–Gastaut syndrome?
Generalized slow spike-and-wave at 2.5 Hz or slower and generalized paroxysmal fast activity at 10 Hz or more are both mandatory for Lennox–Gastaut syndrome (Specchio 2022).
Regression with a quiet awake record: record sleep.
Spot check A 7-year-old with self-limited epilepsy with centrotemporal spikes has lost language and attention over 3 months. A 20-minute awake EEG shows only occasional centrotemporal spikes. What is the next step?
Self-limited epilepsy with centrotemporal spikes can rarely evolve to epileptic encephalopathy with spike-and-wave activation in sleep. A sleep EEG must be performed to confirm the diagnosis, and an overnight recording may be needed to reach slow-wave sleep (Specchio 2022).
Sources: Zuberi 2022, the ILAE definitions of syndromes with onset in neonates and infants; Specchio 2022, the ILAE definitions of syndromes with onset in childhood.
Self-limited focal epilepsies of childhood
The self-limited focal epilepsies of childhood are self-limited epilepsy with centrotemporal spikes, self-limited epilepsy with autonomic seizures, childhood occipital visual epilepsy and photosensitive occipital lobe epilepsy (Specchio 2022). Their records share a normal background with focal discharges that sleep often brings out. The task is to recognize the typical field and to notice the features that do not fit.
Centrotemporal spikes and their dipole
In self-limited epilepsy with centrotemporal spikes, formerly known as benign rolandic epilepsy or benign epilepsy with centrotemporal spikes, onset is usually between 4 and 10 years (range 3–14) in 90% of patients. Seizures are often brief, with somatosensory symptoms, orofacial motor signs, speech arrest and sialorrhea; they occur during sleep in 80–90% and may evolve to a focal to bilateral tonic–clonic seizure (Specchio 2022).
- Mandatory: high-amplitude, over 200 µV peak to trough, centrotemporal sharp-and-slow-wave complexes that activate in drowsiness and sleep. The background and sleep architecture are typically normal.
- Morphology: a triphasic sharp wave, an initial low-amplitude positivity, then a high-amplitude negativity, then a low-amplitude positivity, followed by a slow wave.
- Field: a transverse dipole, frontal positivity with temporoparietal negativity at the same instant.
- Sleep: the discharges become much more frequent in drowsiness and sleep, and can take a broader field and become bilaterally synchronous.
On a longitudinal bipolar montage, the negative maximum sits between the chains’ ends: the left temporal chain reverses phase at T7 and the left parasagittal chain at C3, the same electrode-pair logic as in Bipolar montages and phase reversal. On a referential montage the frontal electrodes swing positive at the instant the centrotemporal electrodes swing negative; that is the dipole. The definition lists three alerts: no activation in sleep, discharges persistently on one side on serial EEGs, and sustained focal slowing outside the postictal period (Specchio 2022).
Posterior spikes: autonomic and visual seizures
Self-limited epilepsy with autonomic seizures, formerly known as Panayiotopoulos syndrome or early-onset benign occipital epilepsy, usually begins between 3 and 6 years. Autonomic features at onset include retching, pallor, flushing and nausea; vomiting occurs in about 75%. Seizures are often prolonged, more than 70% arise from sleep, and they typically remit within 1–2 years. The background is normal, with multifocal high-voltage sharp waves or spike-and-wave, often posterior at onset; their location can vary markedly between recordings and move to the centrotemporal or frontopolar regions. Sleep deprivation and sleep activate them, and eye closure activates the posterior discharges (Specchio 2022).
Childhood occipital visual epilepsy, formerly late-onset benign occipital epilepsy of the Gastaut type, typically begins at 8–9 years. Its mandatory seizures are focal sensory visual seizures during wakefulness, often elementary visual phenomena such as small multicolored circles in peripheral vision, brief and usually lasting seconds; a migraine-like headache follows in half. The background is normal, with occipital sharp waves or spike-and-wave that may appear only in sleep; centrotemporal, frontal or generalized abnormalities are present in 20% (Specchio 2022).
- Fixation-off sensitivity: discharges facilitated when central vision and fixation are eliminated, as by eye closure. It is seen in 20–90% of children with childhood occipital visual epilepsy, also in self-limited epilepsy with autonomic seizures, and is not pathognomonic.
- At the end of a chain: O1 is the last electrode of both left chains of a longitudinal bipolar montage, so an occipital spike shows as the largest deflection in the last channel, without a phase reversal; see Referential montages and common average for the view that confirms it.
For the generalized epilepsies of the same age see Idiopathic generalized epilepsies on EEG, and for the epileptic encephalopathy that centrotemporal spikes can rarely evolve into, Developmental and epileptic encephalopathies on EEG.
Opposite polarities at the same instant over one region describe one source, not two.
Spot check A 7-year-old has brief nocturnal seizures with sialorrhea and speech arrest. In sleep, frequent high-amplitude sharp waves reverse phase at T7 and C3, and on a referential montage F3 and Fp1 swing positive at the same instant. What does the frontal positivity mean?
Centrotemporal spikes have a transverse dipole, frontal positivity with temporoparietal negativity, and they become much more frequent in drowsiness and sleep (Specchio 2022).
Look for what the definition calls an alert.
Spot check A 9-year-old has left centrotemporal sharp waves on three EEGs over a year. They are no more frequent in sleep than awake, never appear on the right, and there is continuous left temporal slowing. How should these records be read?
The ILAE definition lists lack of sleep activation, persistently unilateral centrotemporal abnormalities on serial EEGs and sustained focal slowing not limited to the postictal phase as alerts (Specchio 2022).
In this syndrome the spikes are expected to move.
Spot check A 5-year-old has had two prolonged seizures from sleep with retching, vomiting and pallor. Her first EEG showed occipital spikes; a year later, the spikes are centrotemporal. The background is normal both times. How should the change be read?
In self-limited epilepsy with autonomic seizures the discharges are multifocal and high voltage, often posterior at onset, and their location may vary markedly between sequential EEGs (Specchio 2022).
Sources: Specchio 2022, the ILAE definitions of syndromes with onset in childhood.
Activation procedures
Hyperventilation, intermittent photic stimulation, and sleep may reveal findings absent from the resting record. Describe both the procedure and the EEG response.
Use the laboratory protocol and patient-specific precautions for each procedure.
Hyperventilation (HV)
Typically 3 minutes of deep, rapid breathing (some laboratories extend to 5 minutes when absence seizures are suspected). Hypocapnia produces cerebral vasoconstriction and a fall in cerebral blood flow.
- Normal Response: Generalized slowing (“buildup”), often prominent in children and young adults. Interpret its degree and recovery in context.
- Abnormal Response: Induction of asymmetric focal slowing or generalized 3 Hz Spike-and-Wave discharges (classic absence seizure trigger).
Photic stimulation
Intermittent flashes at rates selected by the laboratory protocol.
- Photic Driving (Normal): Occipital channels synchronize and match the flashing frequency.
- Photoparoxysmal Response (Abnormal): Generalized spike-and-wave or polyspike-and-wave discharges provoked by the strobe. A PPR may be confined to the flash train or persist after it; persistence increases concern but is not required for the definition. A PPR indicates photosensitivity, a largely heritable trait; it is strongly associated with the generalized epilepsies but also occurs in people who never have seizures, so it is interpreted with the clinical history rather than as a diagnosis on its own.
Try both procedures
Read the flash markers along the bottom first. Photic driving is posterior, harmonic to the flash rate, and lacks generalized spike-wave. A photoparoxysmal response adds epileptiform discharges provoked by the stimulus.
Spot check A real photic stimulation page; the flash train is marked along the bottom of the page. What makes a response to the flashes normal rather than epileptogenic?
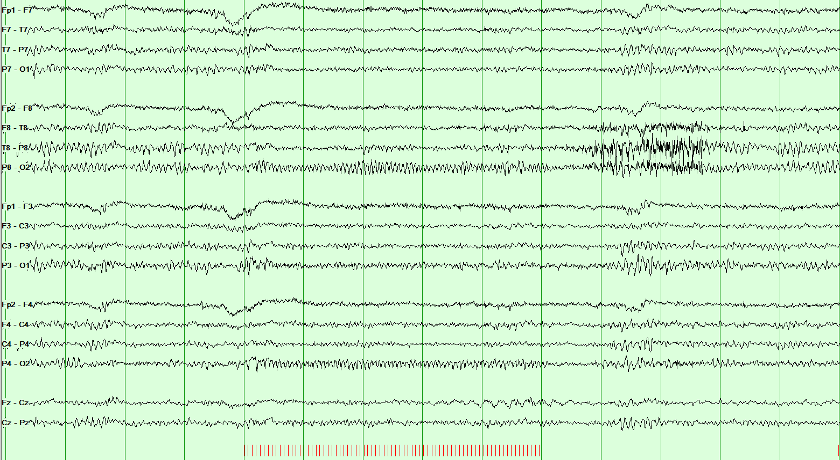
Normal photic driving is a posterior rhythm related to the stimulus frequency or a harmonic. No visible driving response can also be normal. An epileptiform response requires separate assessment.
A photoparoxysmal response is spikes, polyspikes or spike-and-wave provoked by the flashes, confined to the posterior head or generalized; generalized responses carry the strongest link to epilepsy. It may remain limited to the stimulus train or continue afterward; persistence strengthens the abnormality but is not required to call it a photoparoxysmal response.
Read the stimulus markers first. Timing, distribution, and morphology must be interpreted together: ending with the train does not by itself make an epileptiform response normal.
Combine the activation response with the background and transient assessment. The next lesson sets out the criteria for interictal discharges; the critical-care lessons after it separate continuity from the depth of voltage reduction.
Continuity, attenuation, and suppression
Continuity asks whether activity persists across time. Attenuation and suppression ask how far voltage falls. Keep these terms in view while you work the cases: they are the vocabulary the later American Clinical Neurophysiology Society (ACNS) names depend on.
| Term | What it means |
|---|---|
| Focal attenuation | Regional voltage drop; activity continues on that side |
| Attenuation | Voltage 10 µV or more, but under 50% of the background |
| Nearly continuous | Attenuation or suppression occupies under 10% of the record |
| Discontinuity | Attenuation or suppression occupies 10–49% of the record |
| Suppression | Voltage below 10 µV. A suppressed background occupies more than 99% of the record. |
| Burst suppression | Suppression below 10 µV occupies 50–99% of the record, alternating with bursts |
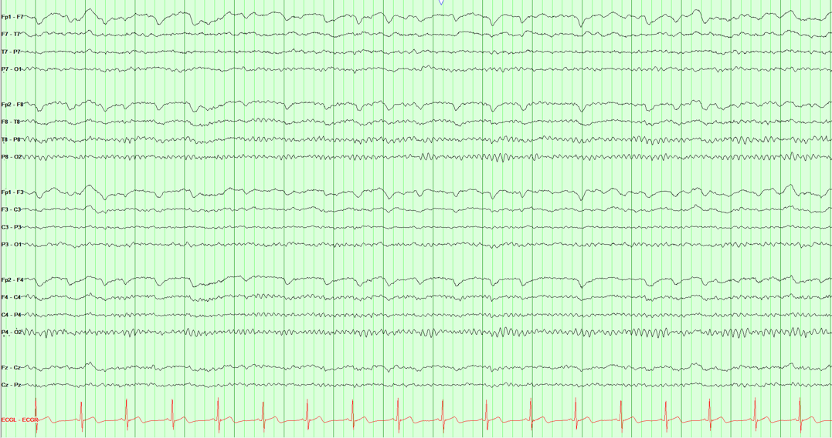
Select a view to begin.
Name continuity by the share of the record that is attenuated or suppressed: 10–49%, 50–99%, or more than 99%.
Spot check A day after cardiac arrest, bursts of mixed activity alternate with stretches in which all activity is below 10 µV. Those stretches fill about 70% of the record. Which American Clinical Neurophysiology Society term fits?
Continuity is named by the share of the record that is attenuated or suppressed: 1–9%, nearly continuous; 10–49%, discontinuous; 50–99%, burst attenuation or burst suppression; more than 99%, attenuated or suppressed. Suppression means all activity below 10 µV (Hirsch 2021).
Continue with Coma, cardiac arrest and prognosis and Neonatal seizures in Board Review.
Once voltage over time has a name, ACNS terminology can name the sustained pattern without deciding whether it is a seizure.
Critical care EEG terminology and the ictal–interictal continuum
Critical care EEG naming follows the American Clinical Neurophysiology Society (ACNS). ACNS critical-care terminology separates description from clinical interpretation. Build the main term from distribution plus pattern, then add modifiers. The name communicates what is on the tracing without presuming cause, seizure status, prognosis, or treatment.

Start with where the pattern is, then whether it is periodic or rhythmic, then add frequency, prevalence, plus-modifiers, fluctuation/evolution, and stimulus relationship.
| Family | Core names | First distinction |
|---|---|---|
| Periodic discharges (PDs) | Lateralized (LPDs), bilateral independent (BIPDs), generalized (GPDs) | Discrete discharges separated by a measurable interval |
| Rhythmic delta activity (RDA) | Lateralized (LRDA), generalized (GRDA) | Continuous repeating delta without an interval between waves |
- Plus modifiers: +F adds fast activity, +R adds superimposed rhythmic or quasi-rhythmic delta activity to PDs, and +S adds sharp waves/spikes to RDA. Do not use LRDA+R: +R applies only to PDs. For RDA, consider +F, +S, or +FS only when the corresponding feature is present.
- BIRDs: Brief potentially ictal rhythmic discharges are focal or generalized rhythmic activity above 4 Hz, lasting at least 0.5 but under 10 seconds, without a definite clinical correlate. They must not be a known normal/benign pattern or part of burst suppression/attenuation, and must show evolution, resemble this patient’s interictal epileptiform discharges or seizures, or have a sharp contour. They are short by definition but carry a strong seizure association.
- SIRPIDs: Stimulus-induced rhythmic, periodic, or ictal-appearing discharges are an umbrella description tied to stimulation, not one morphology or an automatic seizure diagnosis.
- Ictal–interictal continuum (IIC): The continuum is a risk-bearing gray zone, not a diagnosis by appearance alone. Frequency, plus features, evolution, clinical state, medications, imaging, response testing, and temporal context all matter.
Do not add “epileptiform” back into the legacy names. Periodic lateralized epileptiform discharges (PLEDs), bilateral independent PLEDs (BIPLEDs) and generalized periodic epileptiform discharges (GPEDs) are now lateralized, bilateral independent and generalized periodic discharges (LPDs, BIPDs and GPDs), precisely because the descriptive label should not decide ictal significance in advance. Likewise, frontal and occipital intermittent rhythmic delta activity (FIRDA and OIRDA) are now generalized rhythmic delta activity (GRDA), frontally or occipitally predominant (ACNS 2021).
Where a pattern sits
Build the name in order: distribution, then pattern, then modifiers. Each plus modifier belongs to one family only, apart from +F.
Spot check Over the right hemisphere, 1.5 Hz rhythmic delta runs with no interval between waves, and a sharp wave rides on it every few seconds. What is its American Clinical Neurophysiology Society name?
Distribution (lateralized), then pattern (rhythmic delta activity), then modifiers. The plus modifiers mark a more ictal-appearing pattern: +F (fast activity) for either family, +R (rhythmic delta) for periodic discharges only, and +S (sharp waves or spikes, at least once every 10 seconds) for rhythmic delta activity only (Hirsch 2021).
Lateralized rhythmic delta activity above 1 Hz for at least 10 seconds with a plus modifier or fluctuation lies on the ictal–interictal continuum.
Rhythmic activity above 4 Hz lasting under 10 seconds is never rhythmic delta activity, and it is too short to be an electrographic seizure.
Spot check A comatose woman’s earlier seizures began in the left temporal region. A 4-second run of 6 Hz rhythmic activity with the same morphology appears there, with no clinical change. How is it classified?
BIRDs are focal or generalized rhythmic activity above 4 Hz lasting at least 0.5 but under 10 seconds, not a known normal or benign pattern and not part of burst suppression, without a definite clinical correlate, that evolve, resemble the patient’s own discharges or seizures, or are sharply contoured (Hirsch 2021). The same run lasting 10 seconds would be an electrographic seizure.
Slowing and periodic patterns
Compare one full-size tracing at a time. The drawn pages share one ten-second time base and sensitivity, and highlight the involved channels, so distribution can be compared without a scale change. The montage buttons re-derive the same field. The tabs compare focal slowing, generalized periodic discharges (GPDs) with triphasic morphology, and lateralized periodic discharges (LPDs); the LPD example is a recording.
Focal polymorphic slowing
Persistent regional polymorphic delta suggests focal cerebral dysfunction. Structural injury is one possible cause; interpret the finding with clinical history, state, medications, and imaging.
Recognition clues: irregular delta waveforms that persist over a region. The pattern suggests focal dysfunction but does not identify a specific lesion or cause.
Focal slowing is not only delta. Theta (4 to under 8 Hz) over one region is focal slowing too, and intermittent focal theta is usually the milder, less specific finding. The slower and more continuous it is, as in this continuous polymorphic delta, the more often a structural lesion is found.
Generalized periodic discharges (GPDs)
The synchronized complexes are intentionally higher in amplitude here so their three successive phases are easy to inspect. Triphasic describes morphology, not cause. It can occur in toxic-metabolic encephalopathy and other settings; it is not specific to hepatic encephalopathy.
Recognition clues: A measurable interval separates near-identical complexes, and every chain participates at the same time. GPDs are not automatically seizures; frequency, evolution, plus features, duration, and clinical context determine ictal significance.
Lateralized periodic discharges (LPDs)
Discrete complexes recur over the right posterior temporal and parasagittal chains, with a clear interval between them and no mirror field on the left. LPDs commonly accompany acute focal brain injury and carry a meaningful seizure association.
Recognition clues: Distribution first gives lateralized, and the measurable gap gives periodic discharges. LPDs alone do not prove an electrographic seizure; assess frequency, plus modifiers, evolution, clinical findings, and response over time.
Slowing says a region is dysfunctional; how slow and how continuous it is says how likely a structural cause is.
Spot check An awake 58-year-old has continuous irregular 2–3 Hz delta over the left temporal region; the rest of the background, including the posterior dominant rhythm, is normal. What does the finding suggest?
Persistent regional polymorphic delta suggests focal cerebral dysfunction. Structural injury is one possible cause, so interpret it with the history, medications, and imaging. The slower and more continuous the slowing, the more often a structural lesion is found; intermittent focal theta is the milder, less specific end of the same finding.
Name the pattern first, then add the modifier. Triphasic describes morphology, not a cause.
Spot check A confused 70-year-old with kidney failure has generalized periodic discharges at 1.5 Hz with triphasic morphology. Which statement is accurate?
Name the pattern, generalized periodic discharges, then add ‘with triphasic morphology’. Blinded expert review has questioned both the modifier’s link to metabolic encephalopathy and its supposed lack of relationship with seizures (Hirsch 2021).
At more than 1 and up to 2.5 Hz, periodic discharges lie on the ictal–interictal continuum, which often warrants a diagnostic trial of a parenteral antiseizure medication.
Continue with Periodic patterns by cause and The ictal–interictal continuum and seizure risk in Board Review.
Practice: name the rhythmic or periodic pattern
Name patterns in American Clinical Neurophysiology Society (ACNS) order: distribution first (generalized vs lateralized), then periodic vs rhythmic (measurable gap between complexes vs a continuous run). That builds names such as generalized periodic discharges (GPDs), lateralized periodic discharges (LPDs) and lateralized rhythmic delta activity (LRDA). Compare homologous left and right chains to assess lateralization.
If complexes return to baseline between events and the interval is measurable, the pattern is periodic. A continuous waveform with no gap is rhythmic.
Spot check Repetitive complexes in every chain on a real page. ACNS asks one question before any other. Periodic or rhythmic?
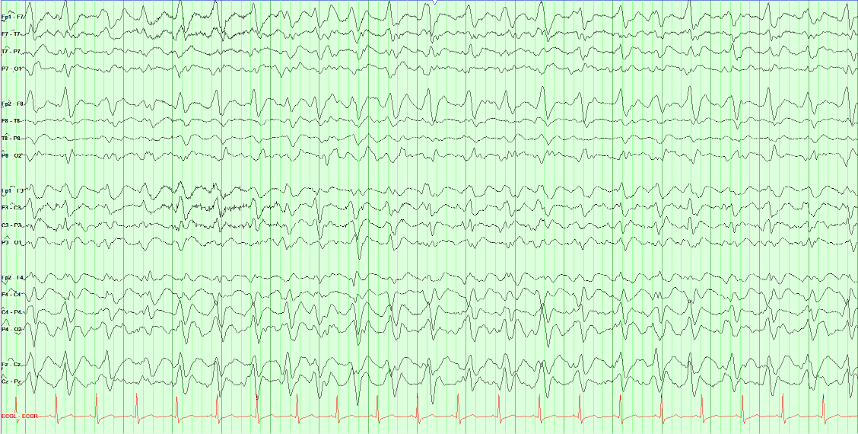
These complexes are periodic because a measurable interval separates successive discharges. Rhythmic waves continue without an interwave interval; they may still cross the baseline.
Generalized distribution plus periodic discharges gives GPDs. The label describes the tracing; it does not determine the cause. A corresponding lateralized pattern is termed LPDs.
Sharpness is not what makes them worrying. Frequency, prevalence, plus-modifiers, fluctuation or evolution, and clinical context determine where a pattern sits on the ictal–interictal continuum. GPDs are not automatically seizures. An electrographic seizure is present if epileptiform discharges average more than 2.5 Hz for at least 10 seconds, or if a pattern shows definite evolution for at least 10 seconds.
LRDA is rhythmic (no measurable gap) and lateralized (larger on one side). Compare each temporal and parasagittal chain with its mirror before picking the maximum.
Spot check Rhythmic delta on a real page, and it is not everywhere. Tap or click the chain where it is largest.
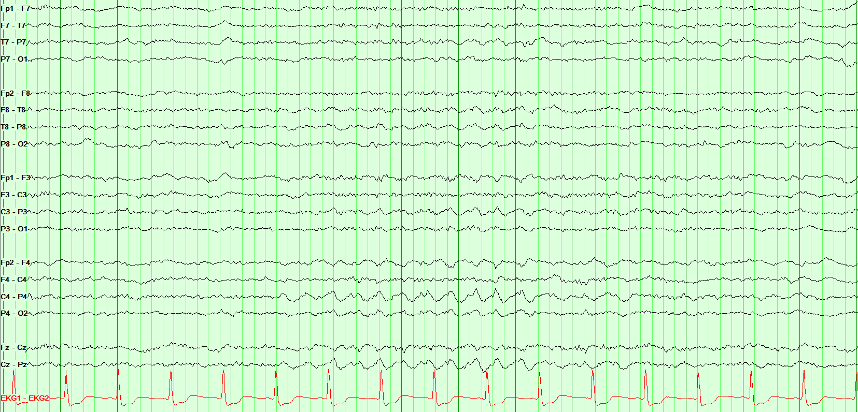
Right lateralized rhythmic delta activity (LRDA). Two things make the call: the waveform is rhythmic (successive waves repeat without a measurable interval between them), and it is lateralized (largest over the right parasagittal region compared with the mirror chain on the left).
Lateralization is always a comparison, never a single-chain judgment. Read each temporal and parasagittal chain against its opposite number, then identify the maximum within the involved hemisphere.
LRDA matters because it carries meaningful seizure association, but plain LRDA is not automatically on the ictal–interictal continuum. Under ACNS criteria, lateralized rhythmic delta activity qualifies for the ictal–interictal continuum when it is above 1 Hz for at least 10 seconds and has a plus modifier or fluctuation. Distinguish it from polymorphic focal slowing, which is irregular rather than rhythmic and usually points toward focal cerebral dysfunction.
About 1 Hz complexes over one hemisphere with a clear interval between them are lateralized periodic discharges (LPDs). GPDs occupy every chain; chewing is myogenic and time-locked to the jaw.
Spot check Discrete complexes recur about once a second, and they are not everywhere. How should this page be named?

Right posterior LPDs. ACNS naming is distribution, then pattern: the complexes are lateralized (right posterior temporal and parasagittal, no left mirror) and periodic (a clear, near-constant interval). That is LPDs, not GPDs and not a seizure by itself.
LPDs commonly accompany acute focal injury and raise seizure risk. Frequency, plus modifiers, evolution, and the clinical examination decide where they sit on the ictal–interictal continuum. Do not put “epileptiform” back into the name.
Two pathways to an electrographic seizure
ACNS recognizes two routes to an electrographic seizure: (1) epileptiform discharges averaging more than 2.5 Hz for at least 10 seconds, or (2) any EEG pattern with definite evolution lasting at least 10 seconds. Definite evolution is sequential change in frequency, morphology, or location under the ACNS criteria; the pattern does not have to change in all three dimensions. To count, there must be at least two unequivocal, sequential changes: in frequency by at least 0.5 Hz each, in the same direction; to a new morphology; or in location, spreading into or out of at least two standard electrode sites. Each change lasts at least 3 cycles. Drag through this left temporal example to see several dimensions change as neighboring cortex is recruited.
Try the evolution pathway: select Onset, then Evolution, then Postictal. Compare frequency, field, and time since onset. Use the slider to inspect the transition between stages.
Read at the green cursor. Stage, frequency, and elapsed time describe that instant. Amplitude is measured across the visible 10-second window, which may include an earlier or later stage. After the seizure ends, postictal time does not extend its duration.
The second route to an electrographic seizure accepts any pattern with definite evolution for at least 10 seconds.
Spot check Over 15 seconds, rhythmic theta in the left temporal chain slows steadily from 6 to 3 Hz and spreads into the left parasagittal chain. It contains no spikes or sharp waves. Is it an electrographic seizure?
There are two routes to an electrographic seizure: epileptiform discharges averaging more than 2.5 Hz for at least 10 seconds, or any pattern with definite evolution lasting at least 10 seconds. Evolution is sequential change in frequency, morphology, or location; one dimension is enough, and a change in amplitude alone does not count (Hirsch 2021).
Seizure practice: onset and distribution
Follow seizure activity through time and compare its distribution across channels. Identify the earliest visible change, the sustained field, and any evolution or spread.
Compare each chain with its mirror on the other side. A seizure is lateralized by the chains that change and evolve while their mirror chains keep the background.
Spot check This page begins with background, then a seizure evolves. Tap or click a full horizontal chain that carries the seizure once it begins.
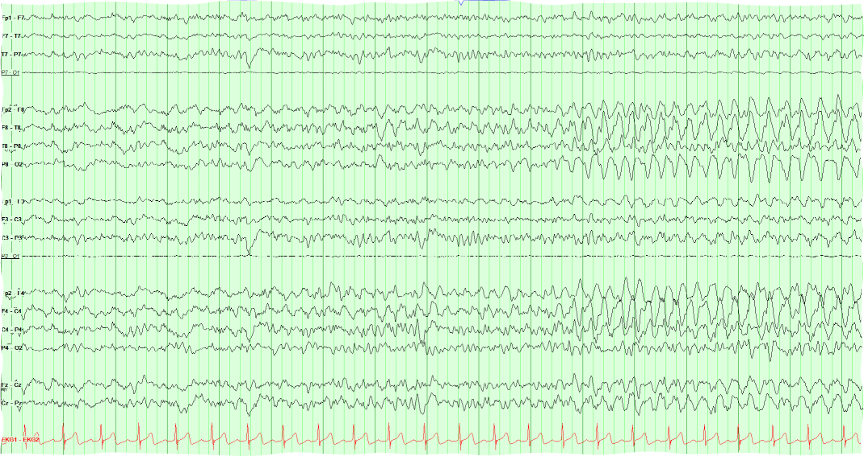
This is a right-sided seizure: both right chains evolve while the left chains keep their background. The early part of the page is background. Partway in, a rhythm appears in the right lateral and right parasagittal chains at about the same moment, then builds in amplitude and changes in frequency and morphology: that change over time is evolution.
Lateralizing is the first step, and this page does it clearly. Which right electrodes carry the maximum is a separate question that a longitudinal bipolar page answers poorly when two chains look alike. Look for the phase reversal, or switch to a referential montage, before naming a lobe.
Look for the first generalized complex and compare it with the preceding background. Judge onset, distribution, and evolution together.
Spot check This page starts normal and then does not. Click where the generalized burst begins.
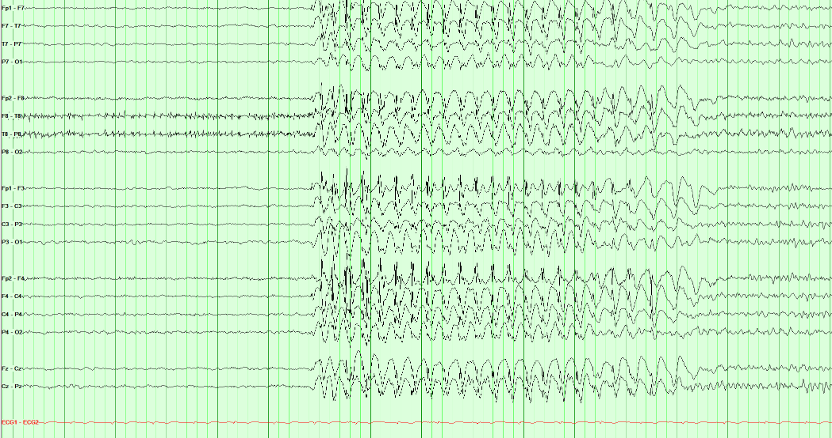
This example shows a generalized spike-and-wave burst with abrupt onset and an organized background before and after. Describe those features before considering syndrome classification.
An organized background between generalized bursts can support a generalized epilepsy syndrome in the appropriate clinical setting. Background appearance alone does not establish the syndrome or exclude a focal onset.
Duration matters, but duration alone does not label the event. A brief generalized spike-wave burst may be electroclinical or subclinical depending on careful testing and video correlation. Absence status epilepticus requires a prolonged generalized epileptiform pattern together with a compatible sustained change in responsiveness or mental state; do not infer it from “a longer-looking burst” without the electroclinical context.
Continue with Seizures on the EEG and Generalized patterns and what they predict in Board Review.
Before accepting an apparent seizure pattern as cerebral, exclude the physiologic and technical artifacts covered earlier in Artifacts & Activation; several of them mimic rhythmicity or evolution.
The neonatal EEG: continuity, graphoelements and seizures
A neonatal EEG is read against postmenstrual age, the gestational age at birth plus the weeks since (Engle 2004). A pattern that is normal at 30 weeks is abnormal at term, and many neonatal seizures are visible only on the EEG. The American Clinical Neurophysiology Society (ACNS) neonatal terminology gives the words and the numbers used here (Tsuchida 2013).
Continuity: the quiet stretches shorten with age
A preterm tracing is normally discontinuous: bursts of higher voltage separated by interburst intervals, stretches in which activity is attenuated below 25 to 50 µV peak to peak for 2 seconds or more. A record is continuous when there is less than 2 seconds of attenuation below 25 µV (Tsuchida 2013).
The longest normal interburst interval shortens as the brain matures. Intervals that are too long, or too low in voltage, for the postmenstrual age are excessive discontinuity; its bursts still contain some normal graphoelements, which separates it from burst suppression. A healthy term infant has most activity at or above 25 µV in every behavioral state (Tsuchida 2013).
| Postmenstrual age | Longest normal interburst interval |
|---|---|
| Before 30 weeks | About 35 seconds |
| 30 to 33 weeks | About 20 seconds |
| 34 to 36 weeks | About 10 seconds |
| 37 to 40 weeks | About 6 seconds |
Graphoelements that tell the age
Delta brushes are slow waves of 0.3 to 1.5 Hz and 50 to 250 µV with fast activity of 8 to 12 or 18 to 22 Hz superimposed. They are most prominent between 24 and 36 weeks, peak at 32 to 34 weeks, and are occasionally seen in quiet sleep up to 40 weeks (Tsuchida 2013).
Encoches frontales are broad diphasic frontal transients of 50 to 100 µV lasting 0.5 to 0.75 seconds, a small initial negative deflection followed by a larger positive one. They are typically synchronous and symmetric and occur between 34 and 44 weeks. Anterior dysrhythmia, frontal delta of 50 to 100 µV alone or in brief runs, appears at 32 weeks and persists to 44 weeks (Tsuchida 2013).
Tracé discontinu is the normal discontinuous pattern of the preterm infant: bursts of 50 to 300 µV regularly interrupted by interburst periods below 25 µV. It is seen in wakefulness, active sleep and quiet sleep until about 30 weeks, afterward only in quiet sleep, and rarely at 38 weeks or later (Tsuchida 2013).
Tracé alternant is the quiet sleep pattern near term: bursts of 50 to 150 µV delta alternate with lower-voltage theta of 25 to 50 µV, and the voltage never falls below 25 µV. It is first seen at 34 to 36 weeks, becomes minimal by 42 weeks and is no longer seen by 46 weeks (Tsuchida 2013).
A normal record changes. Rudimentary sleep cycling can be seen at 25 weeks, spontaneous variability is well established by 30 to 31 weeks, and reactivity to external stimulation first appears at 30 to 32 weeks. Burst suppression is abnormal at any age: bursts without normal graphoelements, interburst voltage below 5 µV, no spontaneous change and no change with noxious stimulation (Tsuchida 2013).
Seizures are defined on the EEG
A neonatal electrographic seizure is a sudden, abnormal event: a repetitive and evolving pattern of at least 2 µV that lasts at least 10 seconds. Evolution is an unequivocal change in frequency, voltage, morphology or location, and no minimum frequency is required. Two seizures count as separate only when 10 seconds or more lie between them (Tsuchida 2013). A change in voltage counts as evolution here; in the adult critical care criteria it does not (Hirsch 2021; see Two pathways to an electrographic seizure).
Many neonatal seizures have no clinical sign. The International League Against Epilepsy (ILAE) classification of neonatal seizures is therefore built on the EEG: it includes electrographic-only seizures and leaves out clinical events without an EEG correlate (Pressler 2021).
Treatment can separate the signs from the seizure. In a trial of two antiseizure medications, 15 of the 26 neonates whose seizures persisted after treatment had uncoupling: at least half of the clinical seizures were suppressed while the electrographic seizures continued (Scher 2003). Judge seizure control in a neonate on the EEG, not at the bedside.
An evolving rhythmic pattern that shares the features of a seizure but lasts less than 10 seconds is a brief rhythmic discharge, not a seizure, in the ACNS terminology (Tsuchida 2013). The ILAE neonatal classification sets no minimum duration and suggests that evolving brief rhythmic discharges may be very brief seizures (Pressler 2021). Neonatal status epilepticus is present when seizures add up to 50% or more of any hour (Tsuchida 2013).
Key points
- Read every neonatal record against postmenstrual age: the longest normal interburst interval falls from about 35 seconds before 30 weeks to about 6 seconds at term.
- Tracé discontinu is the normal discontinuous pattern of the preterm infant. Delta brushes peak at 32 to 34 weeks; encoches frontales belong to 34 to 44 weeks; tracé alternant is term quiet sleep. Burst suppression is never normal.
- A neonatal seizure is an evolving pattern of at least 10 seconds, with no minimum frequency. After treatment the clinical signs can stop while the seizure goes on.
The longest normal interburst interval depends on postmenstrual age: about 20 seconds at 30 to 33 weeks.
Spot check A neonate born at 28 weeks is recorded 3 weeks later. The tracing is discontinuous, with interburst intervals up to 15 seconds, and the bursts contain delta brushes. The record varies with sleep state. How should the continuity be described?
Postmenstrual age is 28 + 3 = 31 weeks. The ACNS neonatal terminology gives about 20 seconds as the longest normal interburst interval at 30 to 33 weeks, and delta brushes peak at 32 to 34 weeks (Tsuchida 2013).
After an antiseizure medication, clinical signs can stop while the electrographic seizure continues.
Spot check A term neonate with hypoxic–ischemic encephalopathy had clonic movements of the left arm with an evolving right central discharge. After an antiseizure medication the arm is still, but the EEG shows a 40-second rhythmic discharge at C4 that slows and spreads to T8. What is it?
Keep recording after treatment: the clinical signs can be suppressed while the electrographic seizures continue (Scher 2003; Tsuchida 2013).
In the neonatal definition, evolution can be in frequency, voltage, morphology or location, and no minimum frequency is required.
Spot check A term neonate has 25 seconds of rhythmic sharp waves at about 1 Hz over C3. They grow steadily in voltage but do not change in frequency and do not spread. Is it a seizure?
A neonatal seizure is a repetitive, evolving pattern of at least 2 µV lasting at least 10 seconds; evolution in frequency, voltage, morphology or location counts (Tsuchida 2013). The ILAE neonatal classification includes electrographic-only seizures (Pressler 2021).
Continue with The neonatal EEG and Neonatal seizures in Board Review, and look back at How normal EEG changes with age.
Sources: Tsuchida 2013 (ACNS neonatal terminology); Pressler 2021 (ILAE neonatal seizures); Scher 2003; Engle 2004; Hirsch 2021.
Coma and prognosis after cardiac arrest
In coma the EEG grades how deeply cortical function is depressed and, after cardiac arrest, adds evidence about recovery. It is read with the time since the injury, the temperature and the medications in view, and it never decides the prognosis alone.
Grade frequency, continuity and reactivity together
Deepening encephalopathy follows a staircase: the background slows to theta and then delta, then becomes discontinuous, then burst suppression, then suppressed. Synek's grades run the same way, from slowing that still reacts to stimulation, which is compatible with survival, to burst suppression and an isoelectric record (Synek 1988).
Name each step in the ACNS 2021 terms: discontinuous when 10 to 49% of the record is attenuated or suppressed, burst suppression or burst attenuation at 50 to 99%, and suppressed when activity is below 10 µV for more than 99% of the record (Hirsch 2021; see Continuity, attenuation, and suppression). Reactivity is a change in voltage or frequency of the cerebral activity with stimulation, including attenuation; muscle activity and eye-blink artifact do not count (Hirsch 2021).
The lowest steps are not always permanent. Hypothermia and sedating drugs can cause reversible cerebral inactivity (Stecker 2016), so prognosis after cardiac arrest is assessed only once residual sedation and hypothermia have been excluded (Nolan 2021), and metabolic derangements are excluded as well before death by neurologic criteria is considered (Greer 2023).
After cardiac arrest: when each finding counts
Timing matters after cardiac arrest. In 850 comatose survivors recorded from 6 hours, generalized suppression below 10 µV, or synchronous patterns with at least 50% suppression, predicted a poor outcome without false positives at 6 hours or later. Their sensitivity was highest early, 0.47 at 12 hours and 0.30 at 24 hours. A continuous background at 12 hours predicted a good outcome, with a sensitivity of 0.50 and a specificity of 0.91; from 24 hours its specificity fell below 0.90. Poor outcome meant a Cerebral Performance Category of 3 to 5 at 6 months (Ruijter 2019).
Later, after rewarming, three highly malignant patterns stand out: suppression, suppression with periodic discharges, and burst suppression. In 103 patients recorded at a median of 77 hours, 37% had one and all had a poor outcome (specificity 100%, sensitivity 50%). A malignant EEG, meaning at least one malignant feature such as periodic or rhythmic patterns, a discontinuous or low-voltage background, or an unreactive background, had a specificity of only 48%; features from at least two of these three groups together had 96%. A benign EEG was found in 1% of patients with a poor outcome (Westhall 2016).
The EEG is one predictor among several. The 2021 European Resuscitation Council and European Society of Intensive Care Medicine guidelines apply a multimodal rule: in a patient still comatose at 72 hours or more after return of spontaneous circulation, with a motor score of 3 or less and confounders excluded, a poor outcome is likely when two or more of six predictors are present (Nolan 2021):
| Predictor of poor outcome | When it counts |
|---|---|
| No pupillary and corneal reflexes | At 72 hours or later |
| Bilaterally absent N20 waves of the somatosensory evoked potential | At 24 hours or later |
| A highly malignant EEG | After 24 hours |
| Neuron-specific enolase above 60 µg/L | At 48 and/or 72 hours |
| Status myoclonus | Within 72 hours |
| Diffuse and extensive anoxic injury on computed tomography or magnetic resonance imaging | On brain imaging |
These guidelines were updated in 2025 (Nolan 2025); check the current version before applying a threshold at the bedside.
Key points
- Grade a comatose record by frequency, continuity and reactivity together, after sedation, hypothermia and metabolic causes are accounted for.
- After cardiac arrest, a continuous background at 12 hours favors recovery; suppression or synchronous patterns with at least 50% suppression from 6 hours, and highly malignant patterns after 24 hours, point to a poor outcome.
- A single malignant feature is weak evidence. Prognosis rests on two or more predictors that agree.
Reactivity is a change in the cerebral activity itself; muscle and eye-blink artifact do not count.
Spot check A comatose patient has a continuous diffuse delta background. A loud clap and a sternal rub bring eye-blink artifact and a burst of muscle artifact, but the delta does not change in voltage or frequency. How is the background described?
Reactivity is a change in voltage or frequency of the cerebral activity with stimulation; muscle activity and eye-blink artifact do not qualify (Hirsch 2021).
Early after cardiac arrest, a continuous background favors recovery, with a specificity of 0.91 at 12 hours.
Spot check Twelve hours after an out-of-hospital cardiac arrest, a comatose 61-year-old has a continuous background of mixed theta and delta. What does this add to the prognosis?
Early EEG works in both directions: a continuous background at 12 hours favors recovery, while suppression from 6 hours points to a poor outcome (Ruijter 2019).
From 72 hours, in a patient still comatose with confounders excluded, a poor outcome is likely when two or more of six predictors agree.
Spot check Four days after cardiac arrest, rewarmed and off sedation, a patient's best motor response is extension. The EEG shows burst suppression, and the N20 waves of the somatosensory evoked potential are absent on both sides. What do the findings support?
Burst suppression is one of the highly malignant patterns; with bilaterally absent N20 waves, two predictors agree (Nolan 2021; Westhall 2016).
Continue with Coma, cardiac arrest and prognosis in Board Review; the periodic and rhythmic patterns are named in Critical care EEG terminology.
Sources: Hirsch 2021 (ACNS critical care terminology); Synek 1988; Ruijter 2019; Westhall 2016; Nolan 2021 and Nolan 2025 (European Resuscitation Council and European Society of Intensive Care Medicine); Stecker 2016; Greer 2023.
Electrocerebral inactivity
Electrocerebral inactivity is a recording finding: no cerebral activity above 2 µV under strict technical conditions. It describes the record; it does not on its own determine death, and since 2023 EEG is no longer an accepted ancillary test for brain death in the United States.
How the record is made
Electrocerebral inactivity is defined as the absence of non-artifactual electrical activity over 2 µV peak to peak, recorded from scalp electrode pairs 10 or more centimeters apart, with interelectrode impedances under 10,000 Ω but over 100 Ω (Stecker 2016).
The ACNS guideline sets the technique: sensitivity raised to 2 µV/mm for at least 30 minutes of the recording, the high-frequency filter not below 30 Hz and the low-frequency filter not above 1 Hz, and each electrode touched gently to show that its channel responds, which tests the integrity of the whole system (Stecker 2016). At a routine sensitivity such as 7 µV/mm, activity of 2 µV is drawn less than a third of a millimeter high on the screen, so a record can look flat when it is not (see Filters and sensitivity).
Every residual wave needs a source
At 2 µV/mm the heart, the ventilator and nearby equipment all show. An electrocardiogram monitor is essential; a pair of electrodes on the back of the hand, about 6 to 7 cm apart, records what reaches the body from outside the brain; and ventilator artifact is documented on the record by the technologist. There should be no EEG reactivity to intense somatosensory, auditory or visual stimuli (Stecker 2016).
What makes inactivity reversible
Hypothermia can cause reversible cerebral inactivity, and hypotension and hypoxemia also reduce cerebral activity. The technologist records the temperature, blood pressure and oxygen saturation, the full medication list with the time sedating drugs were last given, and any toxicology results (Stecker 2016). An EEG cannot substitute for the neurologic examination (Stecker 2016).
Brain death is a clinical determination
Brain death, or death by neurologic criteria, is determined by the neurologic examination and the apnea test once the prerequisites are met: core temperature at least 36 °C, no hypotension, and exclusion of metabolic derangements, intoxication and medications that depress the central nervous system (Greer 2023).
The 2023 guideline of the American Academy of Neurology, American Academy of Pediatrics, Child Neurology Society and Society of Critical Care Medicine uses an ancillary test only when the examination or the apnea test cannot be completed or its findings cannot be interpreted adequately, and accepts only tests of cerebral blood flow: four-vessel catheter angiography, radionuclide perfusion scintigraphy and, in adults only, transcranial Doppler ultrasonography. It recommends against EEG, evoked potentials, computed tomographic angiography and magnetic resonance angiography as ancillary tests; the EEG assesses the cerebral hemispheres, not the brainstem (Greer 2023).
Key points
- Electrocerebral inactivity: no non-artifactual activity over 2 µV between electrodes 10 cm or more apart, read at 2 µV/mm for at least 30 minutes.
- Every residual wave must be matched to a source outside the brain: the heart, the ventilator, the room.
- Hypothermia, hypotension, hypoxemia and depressant drugs make inactivity reversible. Brain death is a clinical determination, and EEG is not an ancillary test for it in the 2023 guideline.
Electrocerebral inactivity is read at 2 µV/mm for at least 30 minutes, between electrodes 10 cm or more apart.
Spot check A record looks flat for 15 minutes at 7 µV/mm on a montage of adjacent electrodes about 6 cm apart. Can electrocerebral inactivity be reported?
ACNS Guideline 6 asks for 2 µV/mm for at least 30 minutes with scalp electrode pairs 10 cm or more apart (Stecker 2016).
At 2 µV/mm, match each residual wave to the electrocardiogram, the ventilator or the hand electrodes.
Spot check At 2 µV/mm, a sharp deflection of about 3 µV appears in every channel, and in the hand electrodes, at the moment of each QRS complex. Nothing else exceeds 2 µV. What is the deflection?
An electrocardiogram monitor and a pair of electrodes on the hand let each residual wave be traced to a source outside the brain (Stecker 2016).
The 2023 guideline accepts only tests of cerebral blood flow as ancillary tests.
Spot check An adult meets every examination criterion for brain death, but the apnea test cannot be completed safely. Which ancillary test does the 2023 guideline support?
Ancillary tests are used when the examination or the apnea test cannot be completed, and only cerebral blood flow studies are accepted (Greer 2023).
Continue with Coma, cardiac arrest and prognosis in Board Review; residual artifact is the subject of Recognizing common artifacts.
Sources: Stecker 2016 (ACNS Guideline 6); Greer 2023 (brain death/death by neurologic criteria guideline).
How ocular artifacts reach the EEG
Artifacts arise from the eyes, muscles, heart, movement, electrodes, or environment. Begin with their distribution and timing, then compare them with video, technologist notes, and auxiliary channels. The eye model below illustrates how ocular fields appear in bipolar channels.
Move the eye and watch the frontal channels
Schematic orientation, not an observer's front view
Choose a blink or move the gaze. The traces show changes from centered gaze; the resting corneoretinal dipole is still present.
How to read this model
The traces show changes from centered gaze. A blink is a brief pulse; the gaze examples show looking away, holding, and returning. Voltages and spatial falloff are illustrative. The blink example includes an upward roll; its degree varies between blinks. The eyelid and rotating globe contribute differently to ocular artifacts. Read the physiology study.
The cornea is positive and the retina negative. The electrode the cornea turns toward becomes relatively positive, and a positive Input 1 is drawn downward.
Spot check A patient looks to the left. In the channels F7–T7 and F8–T8, F7 and F8 are Input 1, and negative is drawn upward. What do the two channels show?
The eye is a dipole, cornea positive and retina negative. Looking left makes the field near F7 relatively positive and near F8 relatively negative; looking right reverses it. With negative drawn upward, F7–T7 deflects down and F8–T8 up: mirror-image deflections, often with brief lateral rectus spikes at each onset.
Recognizing common artifacts
Four common artifacts, each traced to its source: eye blinks, lateral eye movements, scalp muscle (electromyographic, EMG) activity and 60 Hz line interference. Read the field first, then the shape.
Eye blinks
The eyeball behaves as a dipole: the cornea is relatively positive and the retina relatively negative. Eyelid movement over the cornea contributes to the blink potential, which is commonly positive and maximal at Fp1/Fp2. Upward eye rotation may accompany eye closure, but does not explain every blink. In an Fp1–F3 derivation, Fp1 is Input 1; a relatively positive Input 1 produces a downward deflection when negative is displayed upward.
Recognition clues: Look for a bilateral frontal transient time-locked to blinking, usually smaller in more posterior channels. Confirm with eye channels or video; frontal distribution alone does not prove artifact.
Lateral eye movements
Left gaze makes the field near F7 relatively positive and near F8 relatively negative; right gaze reverses the pattern. Display direction depends on each channel’s subtraction. Brief muscle spikes may accompany saccades.
Recognition clues: The mirror-image frontal field matches the corneoretinal dipole and is time-locked to eye movement on video or eye leads. Watch for lateral rectus spikes at each onset.
Muscle (EMG) artifact
Extremely high-frequency, narrow, jagged buzz caused by jaw clenching, chewing, or tension. Classically maximal in temporal channels (T7/T8). Oversmoothing with filters to remove this can artificially round the muscle spikes, causing them to look like cerebral Beta waves.
Recognition clues: Individual motor-unit spikes are visible in the expanded inset. Filtering them rounds them off until they look like cerebral beta, which is the trap.
60 Hz line interference
A regular fast artifact from mains interference, poor or unbalanced electrode contact, nearby equipment, or grounding problems. First inspect electrodes and the environment. A notch filter may reduce residual interference but can distort activity near the filtered frequency and should not replace troubleshooting.
Recognition clues: regular mains-frequency activity. A contact problem may affect channels sharing one electrode; interference can also be widespread. Check the contacts, leads, and environment.
Read the field first: interference confined to the channels that share one electrode points to that electrode.
Spot check A regular 60 Hz sinusoid fills F7–T7 and T7–P7 only, opposite in phase in the two channels. Every other channel is clean. What is the first step?
A poor or unbalanced electrode contact picks up mains interference, and it appears in the channels that share that electrode. Inspect the electrodes, leads, and nearby equipment first; a notch filter may reduce what remains but should not replace troubleshooting.
Artifact practice: field and timing
Read distribution before shape, as in the artifact gallery. Frontal drop-off points to the eyes. Temporal myogenic bursts follow jaw movement. Mechanical rhythms lock to devices on video and non-cerebral channels, such as the electrocardiogram (ECG).
Brief, bilateral, frontal deflections with an untouched posterior background point to the corneoretinal dipole, not a cerebral discharge.
Spot check Brief, repeated, frontally maximal deflections on a real page, and the posterior background is untouched. What are they?
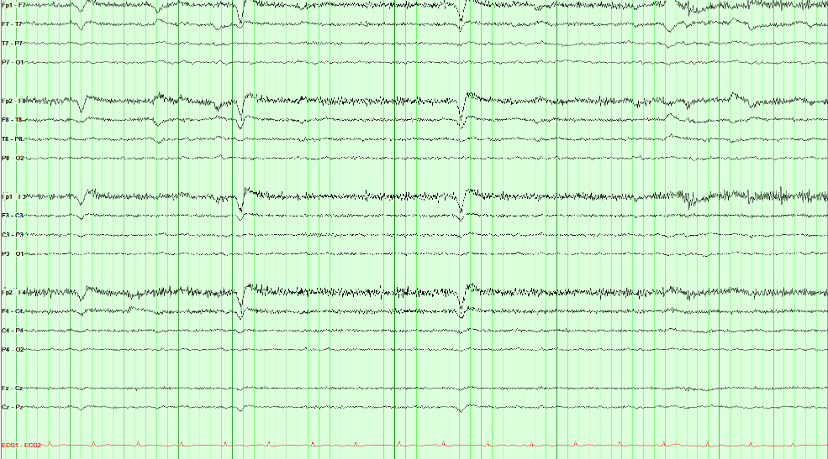
The positive cornea and negative retina form a dipole. Eyelid movement and accompanying eye rotation can produce a brief, bilateral frontal potential, usually largest at Fp1/Fp2.
Three features identify it and all three matter: the distribution is frontal and drops away immediately, the events align with blinking on video or eye leads, and the background elsewhere is unaffected. The repeated shape is compatible with blinks, but epileptiform discharges can also be stereotyped, so stereotypy is not the discriminator.
Eyelid flutter can mimic frontal rhythmic delta. Check its timing against video or eye channels and compare the field across the scalp before assigning a cerebral pattern.
Rhythmic alone is not ictal. Check video, technologist notes, and non-cerebral channels for a mechanical source before calling a seizure.
Spot check A rhythmic pattern is running through this record. Before calling it a seizure, what should you check?
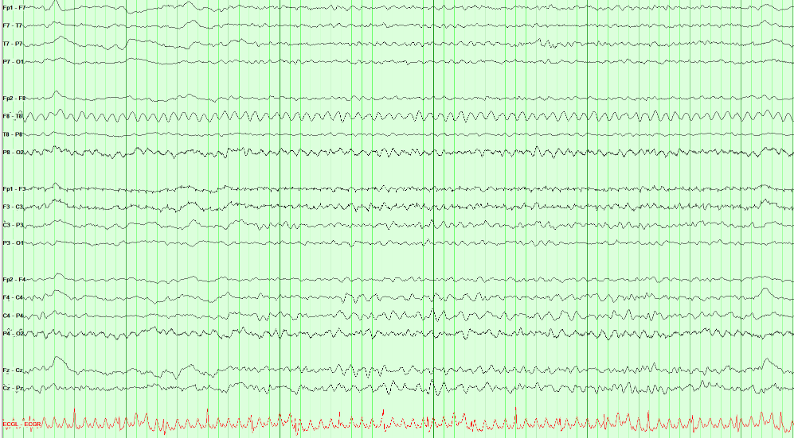
Mechanical devices can drive a highly regular rhythm through the patient and electrode array. A percussor, ventilator, or vibrating bed may produce a fixed rate with no physiologic field, no independent cerebral evolution, and exact temporal coupling to the device.
Lack of evolution alone does not exclude an electrographic seizure, because qualifying epileptiform discharges above 2.5 Hz for at least 10 seconds provide the other pathway. Here, however, the waveform is not an epileptiform discharge and the bedside/video correlation identifies its mechanical source.
Compare the pattern with electrocardiogram (ECG), respiratory, or movement channels when available. Review video and technologist notes for time-locked equipment or patient movement.
A ~1 Hz cadence with electromyographic (muscle) needles densest in the temporal chains, a quiet electrocardiogram (ECG), and no cerebral field is chewing artifact, not periodic discharges or a seizure.
Spot check High-amplitude bursts march through this page about once a second. The electrocardiogram (ECG) underneath is regular. What is contaminating the record?

Chewing is muscle, at the frequency of the jaw. Each burst is packed with high-frequency motor-unit spikes, maximal in the temporal chains, and the ECG is unaffected. Ask the technologist to pause chewing, or watch the video: the page quiets when the jaw does.
The burst rate follows chewing. Temporal muscle distribution, high-frequency components, and a matching jaw movement support artifact; regular repetition alone does not establish a cerebral periodic pattern.
Artifact Hunter: correct the source
Artifact Hunter: Clean the Trace
Click a channel to see what contaminates it, then use the controls to address the source. Click a control again to restore the artifact for comparison. Recognizing electrocardiogram (ECG) artifact leaves the recorded signals intact.
Row labels: LT and RT mark the left and right temporal chains, LP and RP the left and right parasagittal chains, MID the midline; EKG is the electrocardiogram (ECG) channel.
From tracing to report
A report should connect the EEG description to the clinical question. Include relevant state, medications, stimulation, behavior, and technical limitations. Use the sequence below as a writing guide.
Clinical report template
- Study details
- Start time, recording type, duration, electrodes, montages, and any technical limitations.
- Clinical history
- [Age] with possible seizures. Age and the clinical question (in an Epic SmartPhrase, the
@AGE@SmartLink fills the age in). Note recent seizures, temperature, and other major confounders when known. - Central nervous system–active medications
- Sedation, antiseizure medications, and other central nervous system–active drugs that change the tracing.
- Recording day
- Day header for serial or long-term recordings. Repeat the fields below for each day.
- Background
- Describe organization, symmetry, predominant frequencies, anterior–posterior gradient, posterior dominant rhythm frequency and reactivity, variability, and stimulus reactivity.
- Sleep
- Architecture and state changes, separate from the waking background. State whether sleep was captured.
- Continuity and voltage
- Whether activity persists across time, and how far voltage falls (attenuation or suppression).
- Slowing
- Distribution and prevalence. Do not bury this inside the background sentence.
- Activation procedures
- Hyperventilation and photic stimulation: performed or not, and the response.
- Epileptiform, rhythmic, and periodic patterns
- Interictal epileptiform discharge morphology, field, location, and abundance. Name rhythmic or periodic patterns with American Clinical Neurophysiology Society (ACNS) terms and modifiers.
- Seizures and clinical events
- Onset, duration, evolution, and spread. Review video and technologist notes. State whether an electrographic correlate was present and whether awareness was tested.
- Quantitative EEG
- Record quantitative EEG findings if they were reviewed. If quantitative EEG was not part of this study, say so.
- Electrocardiogram (ECG)
- Heart rate and rhythm from the ECG channel. Confirm ECG artifact on the scalp against this channel.
- Impression
- Prioritize the main findings, explain their clinical significance, compare with prior recordings when available, and state meaningful limitations.
- Clinical correlation
- Kept separate from the impression (ACNS Guideline 7): relate the findings to the clinical question, say what they support and what they do not exclude, and what further recording would add.
Your program’s report templates and daily checklists are in its locked guide on the Epilepsy Rotation page.
Review before signing: the impression should summarize the findings and their significance without introducing observations absent from the description.
The impression summarizes the description and explains its significance; it never introduces a new observation.
Spot check Writing the impression, you recall a brief run of left temporal sharp waves that the description never mentions. What should you do?
Review before signing: the impression summarizes the findings and their significance without introducing observations absent from the description. Describe interictal discharges by morphology, field, location, and abundance, then state in the impression what they mean for the clinical question.
Continue with Recording technique for the full reporting framework.
Read a record: transient loss of consciousness
Read a few minutes of EEG the way you would at the reading station: page by page, in more than one montage, with the technologist’s notes and an electrocardiogram (ECG) channel. Then answer the findings checklist. Checking it shows the key, why, links back to the pages that show each finding, and a model report of the record.
Four records follow, each a few minutes long. They are drawn teaching models built from the same field models as the course’s figures, not patient data. Your answers stay in this browser. Use the arrow keys or the page strip to move through the record.
Loading the record…
Read a record: epigastric aura and behavioral arrest
A routine EEG after partial sleep deprivation, with an electrocardiogram (ECG) channel. Read every page, including drowsiness and sleep, before you answer the checklist.
Loading the record…
Read a record: brief behavioral arrest at school
A routine awake EEG in a child, with hyperventilation, photic stimulation and an electrocardiogram (ECG) channel. Read the technologist’s notes as you go: they record what the child was doing.
Loading the record…
Read a record: confusion in the intensive care unit
A portable EEG in the intensive care unit, with reactivity testing and an electrocardiogram (ECG) channel. Describe the background and any periodic or rhythmic pattern in American Clinical Neurophysiology Society (ACNS) terms before you decide what it means.
Loading the record…
Place the 10–20 electrodes
Put each electrode where it belongs until you can find every site without the guides. The nasion, inion and the left and right preauricular points (LPA, RPA) are drawn on the head, and the 10–20 spacing lines can be switched on whenever you need them.
Choose an electrode, then click its position on the head. With the keyboard, focus the head, move the crosshair with the arrow keys (Shift for small steps) and press Enter to place.
This view is a schematic on an idealized head; it supplements supervised technologist training and local protocol. Next, the electrodes are connected into channels.